")
")
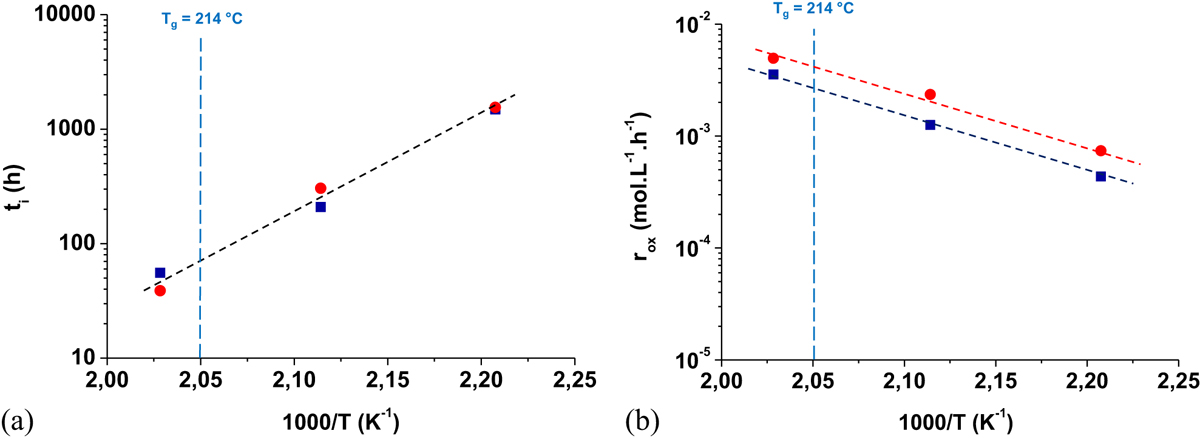
Fig. 7
Download original image
Graphe d’Arrhenius des temps d’induction (a) et des vitesses maximales (b) de disparition des liaisons C–H ( ) et de formation des alcools (
 ) en excès d’oxygène entre 180 et 220 °C.
Arrhenius diagram of the induction times (a) and the maximum rates (b) of the disappearance of C–H bonds () and formation of alcohols () in oxygen excess between 180 and 220 °C.
Current usage metrics show cumulative count of Article Views (full-text article views including HTML views, PDF and ePub downloads, according to the available data) and Abstracts Views on Vision4Press platform.
Data correspond to usage on the plateform after 2015. The current usage metrics is available 48-96 hours after online publication and is updated daily on week days.
Initial download of the metrics may take a while.