")
")
| Issue |
Matériaux & Techniques
Volume 114, Number 4, 2026
Special Issue on ‘Advances in Steel Technologies’, edited by Carlo Mapelli, Silvia Barella and Riccardo Carli
|
|
|---|---|---|
| Article Number | 403 | |
| Number of page(s) | 16 | |
| DOI | https://doi.org/10.1051/mattech/2026018 | |
| Published online | 20 May 2026 | |
Original Article
Assessment of the natural absorption of CO2 performed by steelmaking slag
1
Dipartimento di Meccanica - Politecnico di Milano, Via La Masa 1, 20156 Milano, Italy
2
Fassa Bortolo S.r.l., via Lazzaris 3, 31027 Spresiano (TV), Italy
* e-mail: This email address is being protected from spambots. You need JavaScript enabled to view it.
Received:
22
September
2025
Accepted:
8
April
2026
Abstract
This study aims to evaluate the direct natural wet CO2 absorption potential of steelmaking slag, with a specific focus on the behavior of black and white slag, respectively, collected after the steel production by electric arc furnace and molten steel refining in a ladle furnace. Slag contains significant amounts of calcium and magnesium compounds capable of reacting with atmospheric CO2 through carbonation, forming stable carbonates and thereby enabling permanent carbon sequestration. Representative samples of black and white slag were monitored to assess their physicochemical properties, mineral composition, and carbonation behavior under natural environmental conditions over time. The investigation seeks to characterize and quantify the tendency and rate of CO2 uptake for each slag type, highlighting differences in carbonation efficiency. Preliminary findings contribute to understanding the role of steel slag as potential carbon sinks within the steel industry, supporting sustainability goals. Furthermore, the study discusses the main factors influencing carbonation, such as particle size, exposure time, and ambient conditions, thereby providing insights into slag management optimization and the parallel enhancement of CO2 sequestration during slag-yard stockpiling. This research represents a step forward in incorporating natural carbonation processes of steelmaking by-products into carbon accounting frameworks and promoting their beneficial reuse in climate change mitigation strategies.
Key words: steelmaking slag / CO2 absorption / natural carbonation / carbon sequestration / environmental sustainability
© C. Mapelli et al., 2026
 This is an Open Access article distributed under the terms of the Creative Commons Attribution License (https://creativecommons.org/licenses/by/4.0), which permits unrestricted use, distribution, and reproduction in any medium, provided the original work is properly cited.
1 Introduction
The growing concentration of atmospheric carbon dioxide (CO2) due to anthropogenic emissions represents one of the main drivers of global warming and associated climate change impacts, including ocean acidification and extreme weather phenomena [1–3]. To address these environmental challenges, it is crucial to explore and optimize carbon capture and sequestration (CCS) processes. It should therefore come as no surprise that significant technological advancements have been made in applying CCS to heavy industries, including cement, iron and steel, oil refining, and petrochemicals, over the last decade [4]. Nevertheless, the parallel exploitation of CCS practices based on the natural capture of atmospheric CO2 by heavy industry production residues can contribute even more to reducing environmental impact. Specifically, these natural carbonation practices refer to the spontaneous chemical process in which CO2 reacts with specific metal oxides to produce stable carbonates over time either without any kind of acceleration (ambient conditions) or under enhanced conditions such as higher CO2 concentrations, controlled temperature, and humidity [5,6].
Consequently, the carbonation of alkaline industrial by-products, such as lime and steelmaking slag, has attracted increasing interest due to their potential for permanent CO2 storage in stable mineral forms [5]. On the one hand, lime, produced by the thermal decomposition (calcination) of limestone (CaCO3) into quicklime (CaO) and CO2, can naturally reabsorb a portion of the emitted CO2 during its lifecycle through carbonation reactions, where CaO or hydrated lime (Ca(OH)2) reacts with CO2 to reform calcium carbonate (CaCO3), thus acting as a carbon sink [5,7]. This carbonation process is exothermic and thermodynamically favored. On the other hand, steelmaking slag, the solid residues generated during iron and steel production and in particular those generated during the basic oxygen furnace (BOF), electric arc furnace (EAF), and ladle furnace (LF) processes, contain significant amounts of calcium and magnesium oxides, which make them suitable candidates for natural and enhanced carbonation [5,8]. Although steelmaking slag has been traditionally employed in construction and civil engineering applications, its chemistry and, consequently, carbonation capacity make it an appealing CO2 sequestration medium [9,10]. Studies indicate that the natural carbonation rate of steelmaking slag can reach up to approximately 30% under ambient conditions. This can increase to over 50% under optimized, enhanced carbonation conditions by controlling factors such as particle size, moisture, and CO2 exposure [5,11].
Despite the recognized potential, the natural carbonation behavior of black and white slag remains subject to variability due to differences in mineralogical composition, exposure time, and environmental conditions. Specifically, black slag refers to that produced by EAF steel production, whereas white slag refers to that generated during the molten steel refining process in LF. Furthermore, the carbonation potential of slag must be carefully evaluated, taking into account their mineralogy and respective mineral phase carbonation kinetics. Indeed, if on the one hand the free lime contained in slag completes its spontaneous carbonation within a few years, calcium silicates and aluminates in slag carbonation kinetics are slower [9]. It is worthy to mention that the typical industrial storage times of steel slag often last only a few months before their reuse or disposal, thereby limiting the degree of carbonation achievable [5].
Therefore, monitoring and quantifying the natural CO2 absorption of steelmaking slag is essential for incorporating this property into carbon accounting frameworks and thereby enhancing the sustainability profile of the steel industry, which to date mostly focuses on solely the emissions associated with its products (e.g., pig iron and steel) and processes [11,12]. Indeed, recent assessments suggest that by incorporating the natural carbonation of lime and slag from lime calcination and under current European market conditions, about 23–33% of the process CO2 emissions would be reabsorbed, representing a significant contribution to emission mitigation when accounted for over the lifespan of the materials.
Given these considerations, this work focuses on providing a detailed assessment and monitoring of the natural wet carbonation of steelmaking slag under realistic environmental conditions of slag yards. By systematically analyzing and comparing the progression of CO2 uptake in black and white slag under such conditions, this study also aims to provide quantitative insights into their carbonation potential and the underlying mechanisms. The results will support the development of optimized management strategies for steel slag, leveraging its natural carbonation behavior to enhance carbon sequestration and promote circular economy approaches within the metallurgical sector.
2 Materials and methods
Black and white slag representative samples have been taken from five Italian steel plants equipped with EAF and LF stations. The average chemical composition of each sample has been measured by X-ray fluorescence analysis (XRF) (Tabs. 1 and 2).
As this paper aims to evaluate the natural wet carbonation of steelmaking slag under conditions as close as possible to those currently used in the slag yard, the slag samples were preferentially investigated in their as-received state to simulate a stockpiling period prior to any industrial post-processing (e.g., sieving and/or grinding). However, due to the self-dusting phenomenon affecting white slag after tapping and cooling, its particle size is for the most part lower than 1 mm already in the as-received condition. On the contrary, this does not happen for black slag. As the size distribution of the samples can affect their capacity to absorb CO2 by changing the slag’s overall surface-to-volume ratio, a comparison toward carbonation was conducted between the slag in as-received condition and the sieved fraction below 1 mm. Consequently, a quarter of the slag samples supplied by the steel plants in as-received condition have been sieved through a 1 mm mesh. This step aims at evaluating the amount of the coarse slag fraction (>1 mm) and the fine fraction (<1 mm) contained in each sample. The remaining three quarters were hence fractioned into two groups: as-received slag and fine fraction <1 mm. For black slag whose percentage fraction <1 mm has been less than 5 wt.%, analyses have been performed exclusively just on the raw portion in the as-received conditions.
Before curing, fractioned samples have been divided into 4 aliquots of at least 1.5 kg each. These aliquots have been cured by displacing them on aluminum trays placed on a tray cart positioned outdoors under a canopy. The samples should weigh at least 1.5 kg per tray (compatible with the particle size distribution of the slag itself), and, after the first month of storage, they have been periodically sprayed with tap water every 15 days. To maintain consistency with the standard slag management practices employed in a slag yard, the aliquots were not rabbled.
The CO2 measurement has been performed by the ELTRA-CS 580 Helios elemental analyzer on roughly 200 mg of slag for each examination trial. Each measurement is repeated three times to take into account the intrinsic heterogeneity of the slag.
Since only the amount of CO2 absorbed by the products one year after production has been of interest, it has been decided to analyze the material at 1, 3, and 6 months (30, 90, and 180 days) of atmospheric exposure. One aliquot per each of the investigated slags was taken at the time of analysis, dried in an oven at 70 °C overnight, and then milled and sieved at 0.1 mm. Dried mass at the beginning (day 0) and after each period (30, 90, and 180 days) was also registered.
CO2 uptake was calculated according to equation (1) as proposed by Baciocchi et al. [13]. Although this is the most common and widespread method to quantify CO2 uptake, it may either under- or overestimate the effective uptake due to a lack of accounting for water effects [14]. Consequently, to take into account also the side reactions of dihydroxylation and hydration that inevitably happen during carbonation, the final CO2 concentration should be corrected by the ratio of the slag mass before and after carbonation as proposed by Nielsen and Quaghebeur [14] equation (2).
 (1)
(1)
 (2)
(2)
where CO2 initial is the CO2 concentration detected at day 0, while CO2 final is the CO2 concentration measured at 30, 90, and 180 days; massbefore carbonation is the dry mass of the sample at day 0, while massafter carbonation is the dry mass of the sample after 30, 90, and 180 days.
Ca conversion yield was derived according to equation (3) as proposed by Baciocchi et al. [13]. According to them, Ca was considered the only species involved in the carbonation process, as Mg concentrations resulted in an order of magnitude lower and hence were assumed as non-contributing to the overall carbonation process. Furthermore, in accordance with previous studies, the CO2 uptakes associated with either Mg oxides or silicate phases can be considered negligible with respect to that of Ca oxides [15,16].
 (3)
(3)
where CaO initial is the concentration of CaO measured by XRF.
Experimental CO2 uptake was compared with the theoretical one. The latter evaluated according to the Huntzinger model [17] ((equation 4)).
 (4)
(4)
Slag mineralogy was investigated on both fresh and cured slag at different exposure times by means of X-ray diffraction (XRD). Analyses were performed with a Rigaku Smartlab SE diffractometer in θ–θ configuration using a Cu tube (Kα, λ = 1.54 Å) excited at 40 mA and 40 kV on a powder sample rotated at 30 rpm. Diffraction patterns were acquired from 15° to 70° at 1°/min with a step size of 0.02°. Diffracted beam was acquired by a 1D D/Tex detector with XRF suppression. For the sake of brevity, only results of EAF sample from steel plant 1 and LF slag sample from steel plant 4 are reported and used as supporting data for the discussion.
Average chemical analysis (wt.%) of the black slag from electric arc furnace (EAF) sampled at steel plant (“-” means not detected, “n.m.” means not measured, LOI = loss on ignition).
Average chemical analysis (wt.%) of the white slag from ladle furnace (LF) sampled at steel plant (“-” means not detected, “n.m.” means not measured, LOI = loss on ignition).
3 Results
The results of the performed measurements, provided in Figure 1 and Table 3, have provided several insights into CO2 absorption of EAF slag over time. Specifically, except for the as-received EAF slag sample 4, which exhibits a clear and significant CO2 absorption between 30 and 90 days to then stabilize between 90 and 180 days, the remaining as-received EAF slag samples appear to absorb the atmospheric CO2 slowly and weakly with a linear and continuous trend after 30 days. The overall absolute CO2 concentration of these latter remains below 1 wt.%, whereas that of the as-received EAF slag sample 4 achieved a value of 2.65 wt.% at the end of the monitoring period.
On the contrary, the fraction below 1 mm appears to be more reactive and effective at capturing the CO2. EAF sample 1 below 1 mm shows a rapid increase in CO2 concentration during the first 30 days of exposure, after which the CO2 concentration tends to stabilize, although a positive trend is still evident between 90 and 180 days. However, similarly to the corresponding as-received sample, the overall captured CO2 remains below 1.5 wt.%. Conversely, EAF sample 2 below 1 mm shows a monotonic increase in CO2 of 0.01 wt.% CO2 per day, with significantly higher capacity to capture carbon dioxide than its respective as-received sample. (Fig. 1b).
The comparison of both CO2 uptake and Ca conversion trends, shown in Figure 2, reveals a clearer behavior. Coherently with the CO2 absorption, except for the as-received EAF slag sample 4, the remaining as-received EAF slag samples (Fig. 2a and c) hardly absorb new CO2 due to a very low conversion rate of available CaO. This is probably because CaO is bound in stable, non-reactive mineralogical phases. This is particularly pertinent given that only the natural direct wet carbonation process is investigated in this paper [18, 19]. Moreover, it seems that CO2 begins to be absorbed only after 90 days. Before this, negative uptake could probably indicate the development of other reactions, such as the hydration of alumino-ferrites and their subsequent calcination-decomposition process [20–22]. On the other hand, the improved capacity of the fine fraction to uptake CO2 more efficiently is clearly demonstrated with the two EAF samples below 1 mm, which exhibit similar uptake values and Ca conversion yield yet display different behaviors (Fig. 2b and d). EAF sample 1 below 1 mm seems already buffered, as CO2 uptake remains constant throughout the measurement time span while EAF sample 2 seems to still possess sequestration capacity. Nevertheless, the experimental CO2 uptake values are largely far from those calculated by the Huntzinger model [16]. Indeed, the theoretical CO2 uptake of the investigated EAF slag ranges from 21 to 29.5 wt.%. While it is well known that the carbonation of steelmaking slag does not reach the theoretical value, such a significant discrepancy indicates the poor CO2 sequestration capacity of EAF slag under direct natural wet carbonation.
The comparison between the CO2 uptake determined by means of equations (1) and (2) for EAF slag samples is reported in Figure 3. As can be seen, in case of black slag, the values provided are fully comparable. The only exception is EAF slag sample 2 below 1 mm, for which further investigations are still ongoing. A possible explanation of this behavior relies on the limited hydration reactions that EAF slag generally undergoes when exposed to a moist environment, as confirmed by Nielsen and Quaghebeur [14].
Unlike the EAF slag, the LF slag samples show a continuous increase in absorbed CO2 over 180 days with a flattening trend after 90 days of atmospheric exposure followed by a monotonically increasing trend, as evident in Figure 4 and Table 4. In particular, among the five collected samples, LF slag sample 2 has shown the highest capacity to interact with carbon dioxide. As-received LF slag sample 2, indeed, reached a CO2 concentration of over 7 wt.% after 180 days, whereas the remaining samples reached captured CO2 values between 3 and 4 wt.% (Fig. 4a). Interestingly, the greater capacity of the fraction <1 mm to trap more CO2 is confirmed, with samples 2, 3, and 5 absorbing between 1.5 and 2 times more CO2 than their respective as-received counterparts. At the same time, both samples 1 and 4 behaved exactly as their respective as-received samples (Fig. 4b). This can be explained by the fact that these samples are characterized by a fine fraction of more than 95 wt.% below 1 mm; therefore, the two sample categories are essentially identical. The measured results confirm this and demonstrate the reliability and repeatability of the analytical technique employed.
CO2 uptake for both as received and below 1 mm LF slag confirms that refining slag has greater sequestration potential than EAF slag (Fig. 5). Interestingly, the CO2 uptake achieved through the natural wet carbonation for LF slag (10 wt.% for LF sample 2 below 1 mm) is remarkably similar to that obtained through thin-film carbonation of EAF slag in a 100% CO2 gaseous atmosphere at 10 bar [13, 23].
The comparison between the CO2 uptake determined by means of equations (1) and (2) for LF slag samples is reported in Figure 6. As can be seen, in the case of white slag, the values provided by equation (1) tend to generally overestimate the amount of CO2 uptake. A possible explanation of this behavior relies on the enhanced reactivity of mineralogical compounds featuring LF slag toward hydration.
Although the accelerated carbonation of EAF slag in thin-film configuration took only 10 h to buffer the CO2 uptake, while the LF slag in the current work took 6 months to reach a similar condition, the proposed LF slag management is more sustainable and practical for a steel plant. This is because slag usually remains in the slag yard for at least 6 months to completely stabilize its volume and fully convert all the mineral phases within. Furthermore, the fact that the samples were not rabble during the monitoring period allowed the maintenance of a consistency in the simulation of the slag-yard conditions and, consequently, of the slag carbonation behavior. As carbonation is a diffusion-controlled phenomenon closely related to the degree of interconnected porosity [24], curing conditions (e.g., the exposure time and conditions to moisture and CO2 in the slag yard) are a critical factor in the formation of porous structures [24]. Longer curing times result in a higher degree of hydration and a denser microstructure, particularly in wet conditions [24]. This induces carbonation resistance and results in a lower absolute value of carbonation depth [24]. Therefore, naturally wet carbonated slag takes much longer to reach the same level of carbonation as thin-film accelerated carbonated slag. Nevertheless, without changing the current slag-yard management, it is possible to immobilize the significant amount of CO2 avoiding the expenses for complicated systems such as environmental chambers or carbon capture systems (CCS). Additionally, the LF slag samples here investigated performed sometimes better than other LF slag treated through direct aqueous carbonation in the slurry phase. Indeed, both the CO2 uptake (from 3 to 10 wt.% for fine fraction slag) and Ca conversion yield (from 6 to 24 wt.% for fine fraction) were much higher than those of the LF slag studied by Lekhak et al. [25] and Uibua et al. [26]. Furthermore, the CO2 uptake capacity of the fine fraction does not appear to be exhausted, as the curves have not yet reached a plateau. Additionally, the particle size of the carbonated slag in the above-cited references was finer (<0.1 mm) than the current one, indicating the viability of using self-dusted slag without the need for further grinding and sieving processes to achieve a high sequestration rate. The theoretical CO2 uptake calculated for the five LF slag samples investigated ranges from 38 to 46 wt.%. Thus, intrinsically, LF slag has a double theoretical uptake capacity compared with EAF slag. Although the experimental values are still far from the theoretical ones, the highest measured values and the room for improvements through prolonged exposure highlight once again the key role of LF slag as a suitable CO2 storage sink.
Measurements of CO2 concentration (and its conversion to C) based on ELTRA-CS elemental analysis on the slag coming from EAF (day 0 accounts for the CO2 (and C) concentration measured when the samples were received). Values for standard deviation (St. Dev.) are for CO2 and C, respectively.
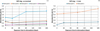 |
Fig. 1 CO2 concentration as a function of exposure time for EAF slag in (a) as-received and (b) below 1 mm conditions. |
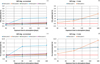 |
Fig. 2 CO2 uptake and Ca conversion yield as a function of exposure time for EAF slag in (a, c) as-received and (b, d) below 1 mm conditions. |
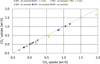 |
Fig. 3 Comparison between CO2 uptake evaluated according to [13] ((equation 1)) and CO2*uptake according to [17] ((equation 2)) for EAF slag samples. |
Measurements of CO2 concentration (and its conversion to C) based on LECO-CS elemental analysis on the slag coming from LF (day 0 accounts for the CO2 (and C) concentration measured when the samples were received). Values for standard deviation (St. Dev.) are for CO2 and C, respectively.
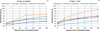 |
Fig. 4 CO2 concentration as a function of exposure time for LF slag in (a) as-received and (b) below 1 mm conditions (standard deviation of CO2 concentration measurements ranges from 0.000 to 0.123 wt.%). |
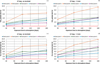 |
Fig. 5 CO2 uptake and Ca conversion yield as a function of exposure time for LF slag in (a, c) as-received and (b, d) below 1 mm conditions. |
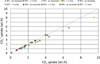 |
Fig. 6 Comparison between CO2 uptake evaluated according to [13] ( (equation 1)) and CO*2 uptake according to [17] ((equation 2)) for LF slag samples. |
4 Discussion
The scientific literature [27] and the current data provided suggest that CO2 uptake by steelmaking slag is primarily the consequence of carbonation reactions, especially when the slag is featured by a significant concentration of CaO and MgO. These alkaline oxides can directly react with CO2 to form carbonates (CaCO3 and MgCO3) and the process is certainly favored by:
high concentration of free CaO and MgO;
high surface area, because the higher the fine fraction, the greater is the CO2 uptake;
amorphous or weakly crystalline phases, which are more prone to CO2 uptake and usually more abundant in white slag than in black slag.
Moreover, the carbonation kinetics are favored by moisture. It has been demonstrated that direct aqueous mineral carbonation shows higher CO2 capture efficiency at room temperature and atmospheric pressure than direct dry gas–solid carbonation. Indeed, the latter is slow, has a low conversion rate, and often requires a long time. It can only be enhanced by applying high temperatures and pressures [18, 19].
For the aforementioned reasons, LF slag has a greater capacity to capture CO2 than EAF slag. Indeed, the examined LF slag has almost twice the amount of CaO and 1.5 times the amount of MgO as EAF slag samples. However, the mere concentration of these oxides is not enough to explain the capture capacity of a steelmaking slag. This is because, during both the steel production in the EAF and its refining in the LF, the several chemical species featuring the slag interact with each other, forming complex compounds that determine the slag’s mineralogy, which in turn governs the slag interaction with the atmospheric CO2. Consequently, whenever a significant amount of CaO is present in the slag, the occurrence of free lime rather than calcium aluminates or silicates will be probable [28]. Free lime offers highly reactive sites available for direct carbonation, as shown in reactions (5). Similarly, MgO also may contribute to CO2 capture, but its effect is much less pronounced than that of CaO.
 (5)
(5)
Furthermore, the role of the other chemical species present in the slag must be considered. SiO2 and Fe2O3 may hinder CO2 capture as they saturate the MgO and CaO content. In contrast, Al2O3 may be beneficial as it stabilizes calcium silicate hydrates, potentially increasing carbonation rates by maintaining the availability of Ca(OH)2 [29]. According to the available literature [30], simple silicates such as larnite (Ca2SiO4) are more reactive toward carbonation than ternary silicates such as akermanite (Ca2MgSi2O8) or merwinite (Ca3MgSi2O8). This is because the substitution of magnesium for calcium in calcium silicate minerals reduces their carbonation reactivity due to the lower mobility of Mg2+ than Ca2+ ion [30]. When the substitution occurs, the newly formed Mg-O bonds are more difficult to break than the Ca-O bonds. This results in lower carbonation reactivity [30,31]. This seems to be confirmed by the current experimental results. Samples with a high CaO/MgO ratio, especially when accompanied by a high binary basicity index (CaO/SiO2) exhibited a pronounced capturing ability. Examples include EAF sample 4 (CaO/MgO = 5.24; BI2 = 2.14) and LF sample 2 (CaO/MgO = 10.02; BI2 = 7.08). Additionally, they feature a high Al2O3 concentration, which boosts their capturing effect (13 and 18 wt.%, respectively) (Fig. 7).
The steeper increase and higher plateau in CO2 content in the white slag correspond directly to their higher CaO concentrations. Conversely, slag from EAF is often higher in Fe2O3 and SiO2 and lower in available CaO, resulting in reduced and slower CO2 absorption. One of the reasons for the negative or very low CO2 uptake of EAF slag before 90 days is the presence of brownmillerite (Ca2(AlFe)2O5), which depends strongly on slag basicity and cooling method [32]. Katoite, also known as hydrogarnet (Ca3Al2(OH)12) [20] is formed through the hydration of brownmillerite, as well as mayenite (Ca12Al14O33) and alite (Ca3Al2O6). It generally forms within the first 7 days of hydration [21]. Hydrogarnet has very low carbonation reactivity and is highly stable [33], which means that it does not easily and completely consume or carbonate under CO2-rich curing conditions. In addition, the products resulting from its carbonation decomposition were primarily vaterite and aragonite, instead of calcite [22, 34], which are relatively unstable calcium carbonate intermediates.
For both the slag groups, the fine fraction below 1 mm demonstrates a greater capacity to absorb atmospheric CO2. In particular, the slag coming from the LF shows a square root relationship over time (Fig. 4b), confirming the importance of diffusion phenomena in regulating CO2 uptake. In fact, a phenomenon that follows a square root law is consistent with Fick’s law [35], meaning that the surface-to-volume ratio of the slag granules increases as the finer fraction increases, which promotes CO2 uptake. To further demonstrate the key role of the fine fraction in the behavior of as-received slag, the difference in absolute CO2 concentration measured after 180 days for fine and as-received slag is plotted against the fine fraction percentage (Fig. 8). As can be seen, when the fine fraction in the as-received sample is negligible, its influence on the CO2 absorption capacity of the as-received slag is limited, and the behavior can mostly be attributed to the slag’s chemistry (and, consequently, its mineralogy), with the contribution of the geometrical shape being insignificant. This results in a significant difference between the values measured for as-received and below-1-mm samples. As the fine fraction increases, the differences between the two groups reduce, as the behavior of the as-received sample is influenced by both chemistry and the fine fraction. When the fine fraction becomes predominant in the slag, as in the case of LF slag that undergoes self-dusting, the difference between the two groups disappears.
Finally, the mineralogical characterization of both fresh and carbonated slag confirms the hypothesis that certain chemical species and mineralogical compounds are responsible for carbonation and clarifies the extent to which this occurs.
The absence of evident carbonation in as-received EAF slag sample 1 is clearly visible in Fig. 9a, which shows the XRD patterns after several days (from 0 to 56). This slag sample mainly consists of compounds that react poorly with moisture, such as gehlenite and wustite, which in turn leads to an absence of hydrate compounds. Although traces of mayenite are detected, they are probably too low to allow identifying the corresponding hydrated form (katoite/hydrogarnet) even after two months of exposure to air. This is also confirmed by the absence of vaterite or aragonite as carbonation products. Similarly, the other silicates identified, γ-dicalcium silicate and merwinite, are known to participate only minimally in hydration followed by carbonation under atmospheric conditions and with limited water contact. Thus, the low carbon captured by the as-received EAF slag sample 1 is a consequence of its mineralogy, which is not optimal for sequestrating atmospheric CO2 under non-accelerated conditions. Similarly, it is possible to state that the more than comparable amount of CO2 captured by the EAF slag sample 1 below 1 mm in comparison with its as-received counterpart was due to the exact same mineralogy shared between the two particle size distributions.
On the contrary, natural carbonation in LF slag occurs quite quickly, with peaks of calcite clearly identifiable just after 14 days (Figs. 10 and 11). It is reasonable to assume that calcite formed through the reaction of portlandite and moisture according to reaction (5), although portlandite was not identified even at day 0. Moreover, the progressive formation of vaterite is observed, which confirms the role of calcium aluminates (i.e., mayenite) in the development of katoite/hydrogarnet during immediate contact with water due to the rapid hydration capacity of calcium aluminates themselves. Experimental results suggest that the LF slag samples were characterized by a sufficient amount and conversion of mayenite to allow detecting hydrogarnet in the diffraction pattern. As reported above, the carbonation of katoite leads to the preferential formation of vaterite rather than calcite. Increasing the exposure time does not result in intensification of the carbonate peaks over time. Instead, the progression in CO2 uptake appears to favor the development of amorphous compounds as evinced by the increased scattering of the XRD pattern background. Calcium silicates appear to play a marginal role in developing carbonation under natural conditions, as their intensities remained practically unchanged. Finally, periclase hardly hydrates, with only weak peaks of brucite detected even after long exposure times. Its carbonation was not identified, which confirms again the poor reactivity of MgO toward CO2 and its limited contribution to sequestration capacity. From a mineralogical point of view, the particle size distributions of LF slag sample 4 are very similar (as received, Fig. 10 and below 1 mm, Fig. 11). However, the peaks associated with carbonates, especially vaterite and calcite, are less defined in the as-received sample. This highlights again the important role of particle fineness (i.e., a high surface-to-volume ratio) in enhancing CO2 uptake and confirms the results reported and discussed in Figures 4 and 5.
Table 5 summarizes the evolution of mineralogical composition as a function of time. From these results, it can be concluded that only some of the several compounds found in steelmaking slag after solidification drive carbonation. Once formed, vaterite and calcite continue to grow, as inferred from the growing intensity of the corresponding diffraction peaks. On the other hand, brucite forms quite fast, but despite the abundance and availability of periclase, its concentration remains constant until day 98 of exposure. It is only after this time that the intensity of periclase peaks decreases simultaneously with a slight increase in the intensity of brucite peaks. Nonetheless, anhydrous MgCO3 does not form since it requires a temperature over 100°C due to the high barrier energy of Mg2+ dehydration [36]. Although calcium aluminates give a less stable form of calcium carbonate (vaterite), they react quickly and supply hydrates for carbonate formation. This is confirmed by the progressive increase in katoite peaks’ intensity over time. In contrast, calcium silicates such as larnite, merwinite and gehlenite do not participate in the hydration reactions and therefore do not contribute to CO2 capture. Consequently, even with high CO2 uptake, the development of full crystalline carbonate compounds remains limited, with CO2 absorption inducing the formation of amorphous compounds.
The results so far highlight the CO2 sink capability of steelmaking slag. This may enable steel producers to report more favorable carbon footprints than those typically reflected in existing LCA databases. To date, the Ecoinvent v3.11 database, according to environmental footprint (EF) method v3.1 [37], states a total carbon footprint of EAF process equal to 539 kgCO2, eq/tonsteel.
Following a carbon footprint partitioning between steel and slag [38], the partitioning factor for carbon steel production was calculated based on each product’s relative economic contribution and using a mass ratio of 0.165 tons of black slag per ton of steel [39] and 0.025 tons of white slag per ton of steel [40]. This allocation method, suggested by Testini et al. [41], yielded an initial carbon footprint for both as-tapped EAF and LF slag equal to 4.8 kg CO2 eq/tonslag. However, after 180 days of curing in the slag yard and under specific conditions (EAF Sample 1 below 1 mm), black slag can absorb an amount of atmospheric CO2 equal to 1% of its mass. This translates to 10 kg of CO2 absorbed per ton of EAF slag. The situation for LF slag is even better. After 180 days of curing, and in the worst-case scenario (LF Sample 4 below 1 mm), white slag absorbs an amount of atmospheric CO2 equal to 3% of its mass. This translates to 30 kg of CO2 absorbed per ton of LF slag. Therefore, by subtracting the amount of CO2 absorbed from the initial carbon footprint of the slag, the net carbon footprint after 180 days of curing of both EAF and LF slag would result in −5.2 and −25.2 kgCO2 eq/tonslag, respectively. By reallocating these contributions to the entire EAF cycle, its initial carbon footprint would be discounted by 0.28%. The relative reductions associated with EAF slag and LF slag are equal to 0.85 and 0.64 kg CO2 eq/tonsteel, respectively. This results in a slightly less footprint for EAF steelmaking, equal to 537.5 kg CO2 eq/tonsteel.
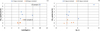 |
Fig. 7 Relationship between CaO/MgO (a) and BI2 (b) with CO2 uptake. |
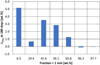 |
Fig. 8 Difference between the absolute concentration of CO2 measured after 180 days of fine slag and the as-received one against the fine fraction below 1 mm percentage. |
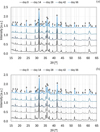 |
Fig. 9 XRD patterns of EAF slag sample 1 in (a) as-received condition and (b) below 1 mm fraction (1—γ dicalcium silicate; 2—gehlenite; 3—mayenite; 4—spinel; 5—quartz; 6—magnesioferrite; 7—monticellite; 8—wüstite). |
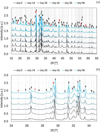 |
Fig. 10 XRD patterns of as-received LF slag sample 4 (a). In panel (b), a zoom of the patterns between 24 and 35° 2θ is reported (1—γ dicalcium silicate; 2—gehlenite; 3—katoite/hydrogarnet; 4—mayenite; 5—brucite; 6—tricalcium silicate; 7—vaterite; 8—calcite; 9—periclase). |
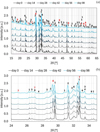 |
Fig. 11 XRD patterns of LF slag sample 4 below 1 mm (a). In panel (b), a zoom of the patterns between 24 and 35° 2θ is reported (1—γ dicalcium silicate; 2—gehlenite; 3—katoite/hydrogarnet; 4—mayenite; 5—brucite; 6—tricalcium silicate; 7—vaterite; 8—calcite; 9—periclase). |
5 Conclusion
In this work five EAF slag samples and five LF slag samples supplied by different Italian steel plants and divided into two categories, as received and fraction below <1 mm, were analyzed to investigate their capacity to uptake atmospheric CO2 under natural direct wet carbonation conditions. CO2 concentration was determined by elemental analysis and measured after 30, 90 and 180 days of atmospheric exposure.
The results allow us to conclude that:
The EAF slag has poor CO2 uptake capacity if compared to LF slag.
Fine fraction below 1 mm is more reactive toward atmospheric CO2 and demonstrates higher uptake capacity than as-received slag.
The sequestration capacity of as-received slag is strongly influenced by the percentage of its fine fraction. The higher the percentage of slag granules below 1 mm, the more similar the CO2 uptake is to that of the fine fraction alone.
Chemical composition is the key determinant for defining the CO2 capture capacity. Slag with a high CaO/MgO ratio, high binary basicity, and significant Al2O3 concentration carbonates faster and reaches a higher pickup of CO2.
LF slag is intrinsically more viable to capture a higher amount of CO2, thanks to its suitable chemical composition and natural tendency to self-dust into fine powder below 1 mm.
LF slag natural CO2 uptake was better than laboratory-controlled carbonation conditions. This will avoid investments in expensive environmental chambers, autoclaves, or carbon-capturing systems without any drastic changes in the management of slag at the slag yard.
The mineralogy is directly responsible for the slag sample’s reaction capacity toward CO2. Calcium aluminates, although they lead to less stable calcium carbonate forms, like vaterite, act as a buffer in supplying water for carbonation. Calcium silicates do not exhibit a significant role at least in the wet natural carbonation process.
Finally, carbonation induces the formation of amorphous compounds at the expense of crystalline ones.
In general, the obtained results highlight the importance of initial slag selection and processing to maximize its reactivity by decreasing crystallinity and grain size to optimize and effective industrial CO2 sequestration.
Funding
This research received no external funding.
Conflicts of interest
The authors have nothing to disclose.
Data availability statement
Data associated with this article cannot be disclosed due to legal reasons.
Author contribution statement
Conceptualization, C.M., E.D.V., R.M., and G.B.; Methodology, C.M. and E.D.V.; Validation, G.D’O. and D.M.; Formal Analysis, E.D.V.; Investigation, E.D.V., D.M., and G.D’O.; Resources, D.M..; Data Curation, D.M..; Writing—Original Draft Preparation, D.M., G.D’O., and E.D.V.; Writing—Review & Editing, C.M., R.M., and G.B.; Visualization, D.M.; Supervision, C.M. and R.M.; Project Administration, C.M., R.M., and G.B.
References
- P. Friedlingstein, M. O'Sullivan, M.W. Jones, et al., Global carbon budget 2020, Earth Syst. Sci. Data 12, 3269 (2020) [CrossRef] [Google Scholar]
- The Intergovernmental Panel on Climate Change (IPCC), Global warming of 1.5°C special report, IPCC, Geneva, 2018. Available: https://www.ipcc.ch/sr15/. [Accessed: 13-Aug-2025]. [Google Scholar]
- I. Parry, Summary for policymakers, in: Implementing a US carbon tax: Challenges and debates, Cambridge University Press, Cambridge, 2015 [Google Scholar]
- L. Kieush, J. Rieger, R. Attrotto, et al., Roadmap for recycling practices and resource utilization in the iron and steelmaking industry: a case studies, Mater. Tech. 112, 503 (2024) [Google Scholar]
- F.P. Campo, C. Tua, L. Biganzoli, et al., Natural and enhanced carbonation of lime in its different applications: A review, Environ. Technol. Rev. 10, 224 (2021) [Google Scholar]
- S.Y. Pan, E.E. Chang, P.C. Chiang, CO2 capture by accelerated carbonation of alkaline wastes: A review on its principles and applications, Aerosol Air Qual. Res. 12, 770 (2012) [Google Scholar]
- R. Scholz, R. Jeschar, R. Jennes, et al., Umweltgesichtspunkte bei der herstellung und anwendung von kalkprodukten, teil 3, ZKG Int. 50, 632 (1997) [Google Scholar]
- S. Manocha, F. Ponchon, Management of lime in steel, Metals 8, 686 (2018) [Google Scholar]
- M. Grosso, L. Biganzoli, F.P. Campo, et al., Literature review on the assessment of the carbonation potential of lime in different markets and beyond, Report prepared by AWARE Research Group at Politecnico di Milano for EuLA, 333 (2020) [Google Scholar]
- L. Rondi, G. Bregoli, S. Sorlini, et al., Concrete with EAF steel slag as aggregate: A comprehensive technical and environmental characterisation, Compos. Part B Eng. 90, 195 (2016) [Google Scholar]
- M. Spanka, T. Mansfeldt, R. Bialucha, Influence of natural and accelerated carbonation of steel slags on their leaching behavior, Steel Res. Int. 87, 798 (2016) [Google Scholar]
- R. Andersson, H. Stripple, T. Gustafsson, et al., Carbonation as a method to improve climate performance for cement based material, Cem. Concr. Res. 124, 105819 (2019) [CrossRef] [Google Scholar]
- R. Baciocchi, G. Costa, E. Di Bartolomeo, A. Polettini, R. Pomi, Wet versus slurry carbonation of EAF steel slag, Greenh. Gases Sci. Technol. 1, 312 (2011) [Google Scholar]
- P. Nielsen, M. Quaghebeur, Determination of the CO2 uptake of construction products manufactured by mineral carbonation, Minerals 13, 1079 (2023) [Google Scholar]
- W.J.J. Huijgen, G.J. Witkamp, R.N.J. Comans, Mineral CO2 sequestration by steel slag carbonation, Environ. Sci. Technol. 39, 9676 (2005) [Google Scholar]
- D.C. Johnson, C.L. Macleod, P.J. Carey, et al., Solidification of stainless steel slag by accelerated carbonation, Environ. Technol. 24, 671 (2003) [Google Scholar]
- Y.R. Yi, Y. Lin, Y.C. Du, et al., Accelerated carbonation of ladle furnace slag and characterization of its mineral phase, Constr. Build. Mater. 276, 122235 (2021) [Google Scholar]
- Z. Chen, Z. Cang, F. Yang, et al., Carbonation of steelmaking slag presents an opportunity for carbon neutral: A review, J. CO2 Util. 54, 101738 (2021) [Google Scholar]
- Y. Zhang, L. Yu, K. Cui, et al., Carbon capture and storage technology by steel-making slags: Recent progress and future challenges, Chem. Eng. J. 455, 140552 (2023) [Google Scholar]
- K. Matern, H. Weigand, R. Kretzschmar, et al., Leaching of hexavalent chromium from young chromite ore processing residue, J. Environ. Qual. 49, 712 (2020) [Google Scholar]
- .F. Santos, K. Schollbach, S. Melzer, et al., Quantitative analysis and phase assemblage of basic oxygen furnace slag hydration, J. Hazard. Mater. 450, 131029 (2023) [Google Scholar]
- X. Wang, Y. Fan, W. Ni, et al., Stimulating CO2 sequestration of aluminum-rich refining slag (ARS): A proposed method of preventing katoite formation using desulfuration gypsum, J. Build. Eng. 63, 105470 (2023) [Google Scholar]
- R. Baciocchi, G. Costa, M. Di Gianfilippo, et al., Thin-film versus slurry-phase carbonation of steel slag: CO2 uptake and effects on mineralogy, J. Hazard. Mater. 283, 302 (2015) [Google Scholar]
- Q. Qiu, A state-of-the-art review on the carbonation process in cementitious materials: Fundamentals and characterization, Constr. Build. Mater. 247, 118503 (2020) [Google Scholar]
- S.N. Lekakh, C.H. Rawlins, D.G.C. Robertson, et al., Kinetics of aqueous leaching and carbonization of steelmaking slag, Metall. Mater. Trans. B 39, 125 (2008) [Google Scholar]
- M. Uibu, R. Kuusik, L. Andreas, et al., The CO2-binding by Ca-Mg-silicates in direct aqueous carbonation of oil shale ash and steel slag, Energy Procedia 4, 925 (2011) [Google Scholar]
- S. Wang, M. Wang, F. Liu, et al., A review on the carbonation of steel slag: Properties, mechanism, and application, Materials 17, 2066 (2024) [Google Scholar]
- R.A. Muvunyi, Y. Hou, S. Li, et al., Dissolution of lime in high-basicity CaO–SiO2–FetO–MgO slag under dynamic conditions, Steel Res. Int. 96, 29 (2025) [Google Scholar]
- J. Li, Q. Yu, H. Huang, et al., Effects of Ca/Si ratio, aluminum and magnesium on the carbonation behavior of calcium silicate hydrate, Materials 12, 1268 (2019) [Google Scholar]
- S. Zhang, X. Zhang, D. Li, et al., The carbonation and hardening properties of larnite, åkermanite and merwinite in steel slag: A study from experiments and DFT calculations, J. Ind. Eng. Chem. 147, 500 (2025) [Google Scholar]
- S. Liu, D. Li, X. Zhang, et al., Utilization of magnesian limestone in carbonatable binders: Reaction mechanisms and performance analysis, Constr. Build. Mater. 469, 140497 (2025) [Google Scholar]
- I. Strandkvist, K. Pålsson, A. Andersson, et al., Minimizing chromium leaching from low-alloy electric arc furnace (EAF) slag by adjusting the basicity and cooling rate to control brownmillerite formation, Appl. Sci. 10, 35 (2020) [Google Scholar]
- J. Plank, M. Zhang-Preße, N.P. Ivleva, et al., Stability of single phase C3A hydrates against pressurized CO2, Constr. Build. Mater. 122, 426 (2016) [Google Scholar]
- X. Zhu, T. Zhang, Y. Wang, et al., Non-isothermal decomposition kinetics of hydrogarnet in sodium carbonate solution, Chinese J. Chem. Eng. 23, 1634 (2015) [Google Scholar]
- G. Murray, C.V. White, W. Weise, Introduction to Engineering Materials CRC Press, Boca Raton, 2007 [Google Scholar]
- L. Hopkinson, P. Kristova, K. Rutt, et al., Phase transitions in the system MgO–CO2–H2O during CO2 degassing of Mg-bearing solutions, Geochim. Cosmochim. Acta 76, 1 (2012) [Google Scholar]
- S. Andreasi Bassi, F. Biganzoli, N. Ferrara, et al., Updated characterisation and normalisation factors for the environmental footprint 3.1 method, Publications Office of the European Union, Bruxelles, 2023. [Google Scholar]
- Environmental management - Life cycle assessment – Requirements and guidelines - EN ISO 14044:2006þA1:2018, Geneve, Switzerland (2018) [Google Scholar]
- D. Mombelli, S. Scolari, G. Dall’Osto, et al., Quantitative phase analysis in carbon steel EAF slag for the determination of phase-controlled leaching mechanism, J. Phys. Conf. Ser. 3050, 012004 (2025) [Google Scholar]
- P. Araos, D. Aponte, M. Barra, Ladle furnace slag as a new source of supplementary cementitious material: Evaluating long-term performance and environmental impact in Portland cement systems, J. Build. Eng. 95, 109995 (2024) [Google Scholar]
- L. Testini, D. Mombelli, G. Dotelli, et al., Outline of a washing treatment to improve electric arc furnace slag environmental behavior, Steel Res. Int. (2025) [Google Scholar]
Cite this article as: Carlo Mapelli, Davide Mombelli, Gianluca Dall’Osto, Elena Da Val, Roberto Moreschi, Giovanni Baldo, Assessment of the natural absorption of CO2 performed by steelmaking slag, Matériaux & Techniques 114, 403 (2026), https://doi.org/10.1051/mattech/2026018
All Tables
Average chemical analysis (wt.%) of the black slag from electric arc furnace (EAF) sampled at steel plant (“-” means not detected, “n.m.” means not measured, LOI = loss on ignition).
Average chemical analysis (wt.%) of the white slag from ladle furnace (LF) sampled at steel plant (“-” means not detected, “n.m.” means not measured, LOI = loss on ignition).
Measurements of CO2 concentration (and its conversion to C) based on ELTRA-CS elemental analysis on the slag coming from EAF (day 0 accounts for the CO2 (and C) concentration measured when the samples were received). Values for standard deviation (St. Dev.) are for CO2 and C, respectively.
Measurements of CO2 concentration (and its conversion to C) based on LECO-CS elemental analysis on the slag coming from LF (day 0 accounts for the CO2 (and C) concentration measured when the samples were received). Values for standard deviation (St. Dev.) are for CO2 and C, respectively.
All Figures
|
Fig. 1 CO2 concentration as a function of exposure time for EAF slag in (a) as-received and (b) below 1 mm conditions. |
| In the text | |
|
Fig. 2 CO2 uptake and Ca conversion yield as a function of exposure time for EAF slag in (a, c) as-received and (b, d) below 1 mm conditions. |
| In the text | |
|
Fig. 3 Comparison between CO2 uptake evaluated according to [13] ((equation 1)) and CO2*uptake according to [17] ((equation 2)) for EAF slag samples. |
| In the text | |
|
Fig. 4 CO2 concentration as a function of exposure time for LF slag in (a) as-received and (b) below 1 mm conditions (standard deviation of CO2 concentration measurements ranges from 0.000 to 0.123 wt.%). |
| In the text | |
|
Fig. 5 CO2 uptake and Ca conversion yield as a function of exposure time for LF slag in (a, c) as-received and (b, d) below 1 mm conditions. |
| In the text | |
|
Fig. 6 Comparison between CO2 uptake evaluated according to [13] ( (equation 1)) and CO*2 uptake according to [17] ((equation 2)) for LF slag samples. |
| In the text | |
|
Fig. 7 Relationship between CaO/MgO (a) and BI2 (b) with CO2 uptake. |
| In the text | |
|
Fig. 8 Difference between the absolute concentration of CO2 measured after 180 days of fine slag and the as-received one against the fine fraction below 1 mm percentage. |
| In the text | |
|
Fig. 9 XRD patterns of EAF slag sample 1 in (a) as-received condition and (b) below 1 mm fraction (1—γ dicalcium silicate; 2—gehlenite; 3—mayenite; 4—spinel; 5—quartz; 6—magnesioferrite; 7—monticellite; 8—wüstite). |
| In the text | |
|
Fig. 10 XRD patterns of as-received LF slag sample 4 (a). In panel (b), a zoom of the patterns between 24 and 35° 2θ is reported (1—γ dicalcium silicate; 2—gehlenite; 3—katoite/hydrogarnet; 4—mayenite; 5—brucite; 6—tricalcium silicate; 7—vaterite; 8—calcite; 9—periclase). |
| In the text | |
|
Fig. 11 XRD patterns of LF slag sample 4 below 1 mm (a). In panel (b), a zoom of the patterns between 24 and 35° 2θ is reported (1—γ dicalcium silicate; 2—gehlenite; 3—katoite/hydrogarnet; 4—mayenite; 5—brucite; 6—tricalcium silicate; 7—vaterite; 8—calcite; 9—periclase). |
| In the text | |
Current usage metrics show cumulative count of Article Views (full-text article views including HTML views, PDF and ePub downloads, according to the available data) and Abstracts Views on Vision4Press platform.
Data correspond to usage on the plateform after 2015. The current usage metrics is available 48-96 hours after online publication and is updated daily on week days.
Initial download of the metrics may take a while.