")
")
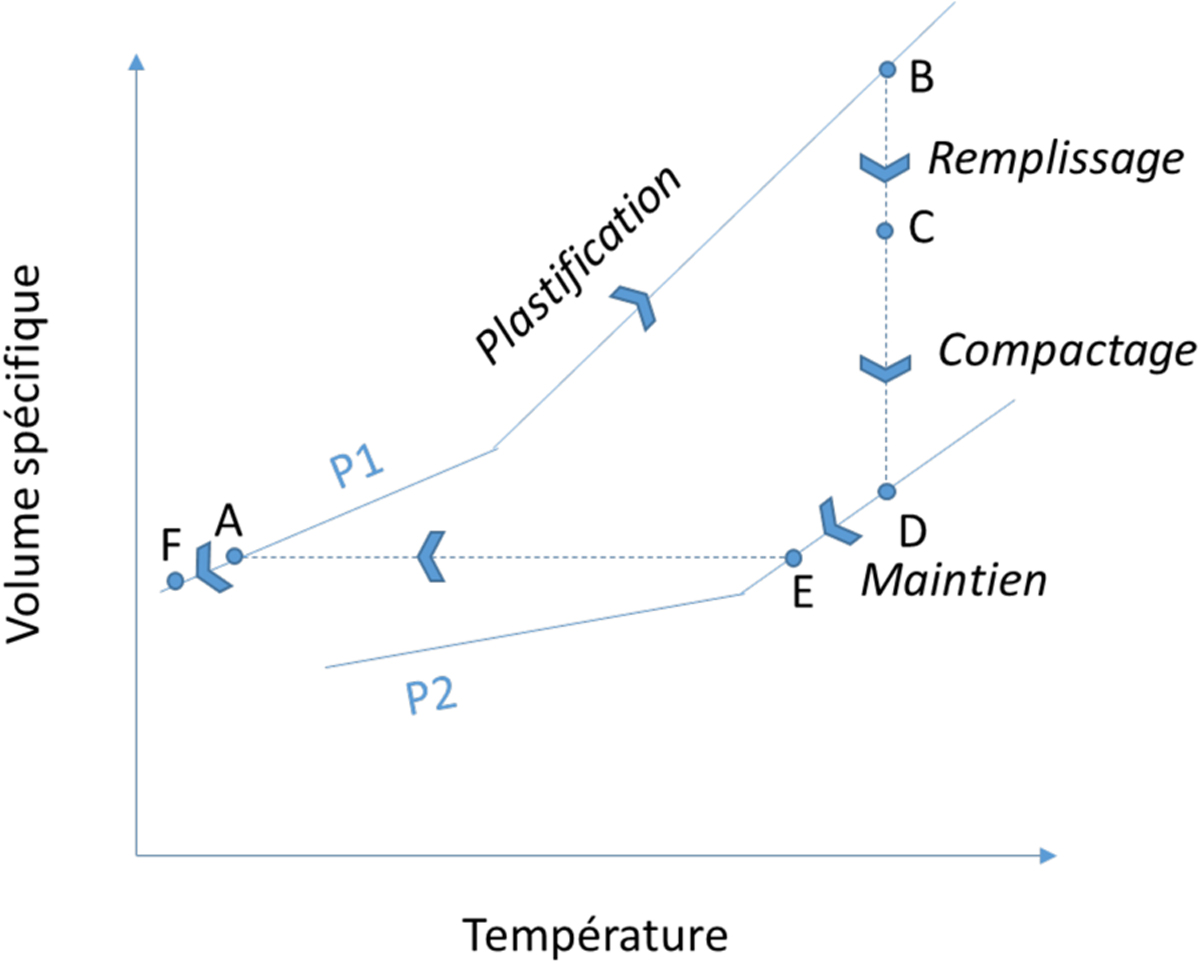
Fig. 8
Download original image
À partir du diagramme PVT d'un polymère amorphe, schéma du trajet virtuel décrit par ce polymère durant un cycle d'injection, d'après [41]. P1 et P2 sont deux pressions auxquelles sont soumis le polymère dans les phases considérées, typiquement P1 est de l'ordre du dixième de MPa tandis que P2 est de l'ordre de la dizaine de MPa.
From the PVT diagram of an amorphous polymer, a diagram of the virtual pathway described by this polymer during an injection cycle, according to [41]. P1 and P2 are two pressures to which the polymer is subjected in the phases under consideration, typically P1 is of the order of one tenth of MPa while P2 is of the order of ten of MPa.
Current usage metrics show cumulative count of Article Views (full-text article views including HTML views, PDF and ePub downloads, according to the available data) and Abstracts Views on Vision4Press platform.
Data correspond to usage on the plateform after 2015. The current usage metrics is available 48-96 hours after online publication and is updated daily on week days.
Initial download of the metrics may take a while.