")
")
Fig. 7
Download original image
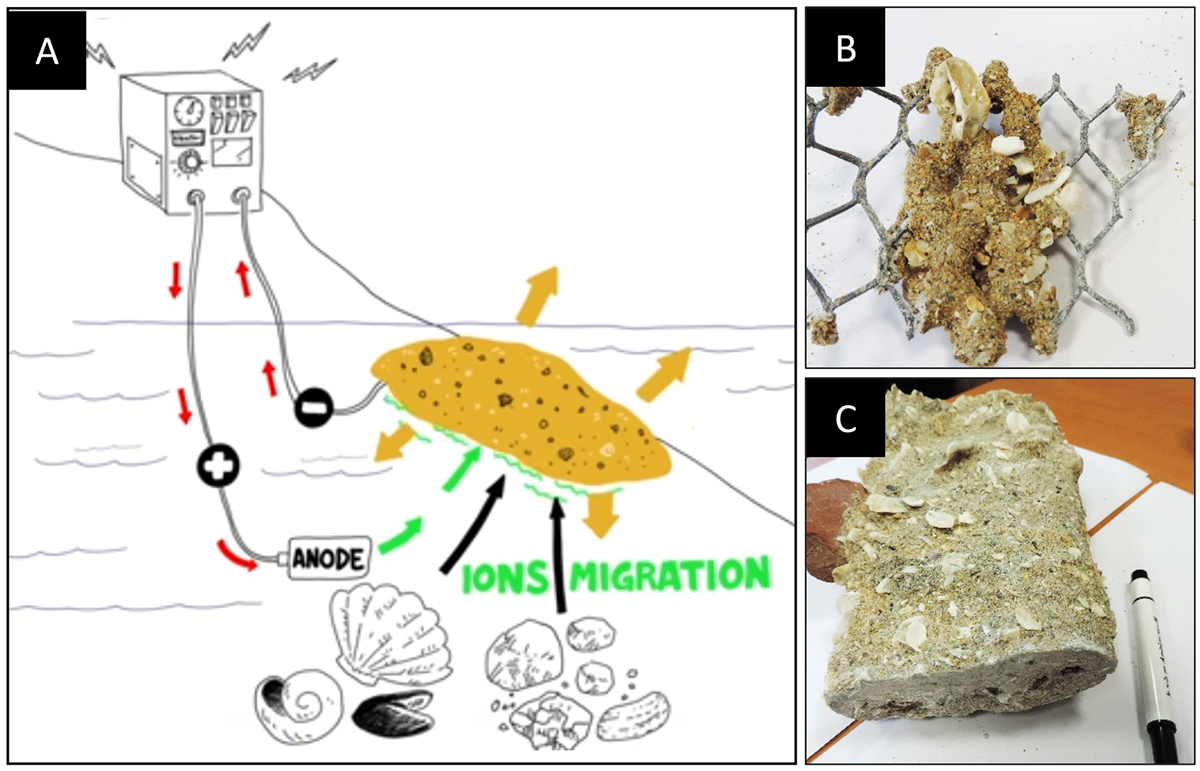
Formation d’agglomérat minéral liant les sédiments entre eux par polarisation cathodique en milieu marin (A) avec des agglomérats obtenus après 1 mois (B) et 12 mois de polarisation (C) [164]. Le processus schématisé en A consiste à polariser cathodiquement une grille métallique ensevelie dans des sédiments marins (les flèches rouges représentent le courant électrique permettant la polarisation cathodique). Le dépôt calcomagnésien va ainsi précipiter à la surface du support métallique sous l’action de cette polarisation et par migration des ions calciques et magnésiens présents dans l’eau de mer (flèches vertes). Ce dépôt va croître avec le temps (flèches oranges) et va également cimenter les coquillages et les sédiments marins entre eux (flèches noires). Après 1 mois de polarisation (B), le dépôt calcomagnésien formé ne recouvre pas totalement la grille métallique alors qu’après 12 mois de polarisation (C), le support métallique est entièrement recouvert de dépôt calcomagnésien.
Agglomerate formation by cathodic polarisation in the marine environment (A) with agglomerates obtained after 1 month (B) and 12 months of polarisation (C) [164]. The process shown in A consists of cathodically polarising a metal grid embedded in marine sediments (the red arrows represent the electric current allowing cathodic polarisation). The calcareous deposit will then precipitate on the surface of the metal support under the action of this polarisation and by migration of the calcium and magnesium ions present in the sea water (green arrows). This deposit will grow with time (orange arrows) and will also cement the shells and marine sediments together (black arrows). After 1 month of polarisation (B), the calcareous deposit formed does not completely cover the metal grid, whereas after 12 months of polarisation (C), the metal support is completely covered with calcareous deposit.
Current usage metrics show cumulative count of Article Views (full-text article views including HTML views, PDF and ePub downloads, according to the available data) and Abstracts Views on Vision4Press platform.
Data correspond to usage on the plateform after 2015. The current usage metrics is available 48-96 hours after online publication and is updated daily on week days.
Initial download of the metrics may take a while.