")
")
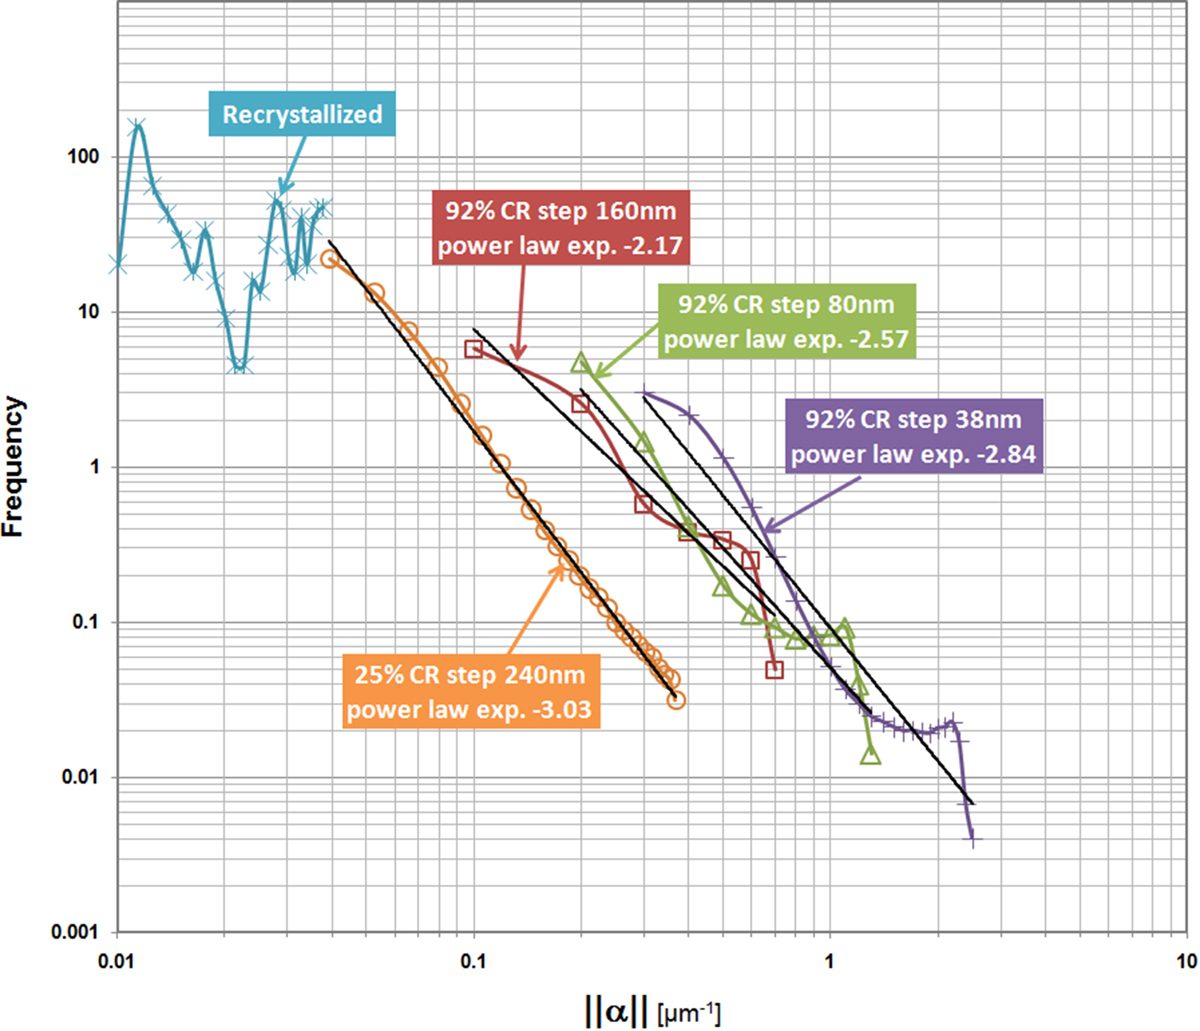
Fig. 11
Download original image
Distribution of measurable dislocation density in Recrystallized (pale blue curve), 25% cold rolled (orange curve) and 92% cold rolled (red, green and dark blue curves) samples. The red, green and dark blue curves respectively correspond to the 160, 80 and 38 nm resolution step sizes.
Distribution de la densité de dislocations mesurable ∥α∥ dans le matériau recristallisé (courbe bleu clair), faiblement laminé (taux de réduction de 25 %) (courbe orange) et fortement laminé (taux de réduction de 92 %) (courbes rouge, vert et bleu foncé). Les courbes rouge, vert et bleu foncé correspondent respectivement aux pas de résolution spatiale de 160, 80 et 38 nm.
Current usage metrics show cumulative count of Article Views (full-text article views including HTML views, PDF and ePub downloads, according to the available data) and Abstracts Views on Vision4Press platform.
Data correspond to usage on the plateform after 2015. The current usage metrics is available 48-96 hours after online publication and is updated daily on week days.
Initial download of the metrics may take a while.