")
")
| Issue |
Matériaux & Techniques
Volume 106, Number 1, 2018
Control, modeling and characterization of heat treatment and surface engineering
|
|
|---|---|---|
| Article Number | 105 | |
| Number of page(s) | 7 | |
| Section | Modélisation et simulation : procédés d’élaboration et de traitement / Modelling and simulation : materials processing | |
| DOI | https://doi.org/10.1051/mattech/2018034 | |
| Published online | 01 August 2018 | |
Regular Article
Prediction of the grain size evolution during thermal treatments at the mesoscopic scale: a numerical framework and industrial examples
Prédiction de l’évolution de taille de grains à l’échelle mésoscopique lors des traitements thermiques : un cadre numérique et des exemples industriels
1
Transvalor S.A., Parc de Haute Technologie, Sophia Antipolis,
694 avenue du Docteur Maurice Donat,
06250
Mougins, France
2
Mines ParisTech, PSL Research University, CEMEF Centre de mise en forme des matériaux, CNRS UMR 7635,
CS 10207,
rue Claude Daunesse,
06904
Sophia Antipolis cedex, France
* e-mail: This email address is being protected from spambots. You need JavaScript enabled to view it.
Received:
26
January
2018
Accepted:
21
June
2018
Abstract
Recently, an original full field model working at the mesoscopic scale using the level set (LS) method in a finite element (FE) framework has been introduced. This approach has demonstrated its potential for the simulation of grain growth and recrystallization problems. Through the development of the DIGIMU® software, this methodology is now considered for industrial applications. The paper presents (i) the recent developments made on the LS approach and (ii) some examples of large scale simulations in two and three dimensions considering thermal treatments applied on materials. Grain boundaries motion considering the presence or not of second phase particles (like precipitates) are investigated.
Résumé
Récemment, une nouvelle approche champ complet de type level set (LS) dans un contexte éléments finis (EF) oeuvrant à l’échelle mésoscopique a été proposée. Le potentiel de cette approche pour la simulation des mécanismes de croissance de grains et de recristallisation a été démontré. À travers le développement du logiciel DIGIMU®, cette approche est maintenant considérée pour des applications industrielles. Cet article présente (i) des évolutions récentes du modèle LS et (ii) différents exemples de simulations de traitements thermiques sur des polycristaux de grande taille en 2D et 3D. La présence éventuelle de particules de seconde phase sur la migration des joints de grains est également considérée.
Key words: mesoscale modeling / level set numerical method / finite element modeling / grain growth / Smith-Zener pinning
Mots clés : modélisation à l’échelle mésoscopique / méthode level-set / modélisation éléments finis / croissance de grains / ancrage de Smith-Zener
© EDP Sciences, 2018
1 Introduction
Mechanical and functional properties of metallic materials are strongly related to their microstructures, which are themselves inherited from thermal and mechanical processing. A precise control of the grain size evolution during these thermomechanical and thermal treatments is one of the key factors for reaching the required final in-use material properties, particularly for the aerospace and nuclear industries. An accurate prediction of the grain size is thus of prime importance. The goal is to correctly describe the main physical mechanisms occurring in metals i.e. grain boundary (GB) migration, work-hardening, recovery, nucleation and grain growth related to dynamic, static or metadynamic recrystallization.
Macroscopic and homogenized metallurgical models are widely used, mainly due to their low computational cost [1,2]. If this mean field framework is quite convenient, it can be synonymous for a given material of a large amount of experiments with advanced laboratory devices. Moreover, the homogenization of the microstructure does not permit to capture some very local phenomena. In order to overcome these issues, lower-scale models (called full field models) have been developed over the last decades with the aim to simulate explicitly the microstructural evolution [3–5]. The idea behind these “mesoscale” simulations is that the morphology and the topology of the GB network plays a non-negligible role in the evolution of the microstructure. In these approaches, simulations are performed on Representative Volume Elements (RVEs) where the microstructural features are explicitly represented. Boundary conditions applied to the RVE are representative of what suffered a material point at the macroscopic scale (thermal or thermomechanical cycle).
Recently a new full field approach, based on a LS description of the interfaces in a FE context has been introduced to model primary recrystallization, including the nucleation stage, and has been extended to take into account the grain growth stage of monophasic polycrystalline structures [6–8]. Moreover in this LS context, Smith-Zener pinning (SZP) phenomenon can be taken into account in a natural way [9]. Modeling at the mesoscopic scale can thus be a help for understanding complex microstructural phenomena such as abnormal grain growth; it can also be used to optimize/calibrate higher scale models through numerical experiments leading to a real multiscale approach. Full field models are generally associated with high computation times. Recent major developments and improvements made on the LS approach [10,11] make possible its use in an industrial context. After introducing the FE-LS numerical model in the next section, some examples of large scale simulations in 2D and 3D are presented. This paper focuses on thermal treatments.
2 Numerical model description
2.1 Level Set (LS) function
The microstructural evolution is given by the displacement of interfaces (grain boundaries for example). The model considered here works around a LS description of the interfaces in a FE framework. This method has the advantage of avoiding the difficult problem of tracking interfaces. Indeed a LS function ψ is defined over a domain Ω as the signed distance function to the interface of a sub-domain G of Ω. The values of ψ are calculated at each mesh node and the sign is defined as positive inside G and negative outside:
 (1)
where d(.,.) corresponds to the Euclidean distance. The interface is implicitly given by the level 0 of the function ψ.
(1)
where d(.,.) corresponds to the Euclidean distance. The interface is implicitly given by the level 0 of the function ψ.
Theoretically, each grain of a polycrystal must be represented by its own LS function. In practice, non-neighbouring grains in the initial microstructure (separated by a certain number of grains) can be grouped to form global LS (GLS) functions. This approach allows using a small number of functions Np compared to the total number of grains constituting the microstructure Ng and thus limits the numerical cost. The interface of each GLS function is then displaced by solving a set of convective-diffusive equations [7]:
 (2)
where m and γ are respectively the GB mobility and energy. The diffusive term refers to capillarity effects while the convective one is related to stored energy gradients throughout the microstructure.
(2)
where m and γ are respectively the GB mobility and energy. The diffusive term refers to capillarity effects while the convective one is related to stored energy gradients throughout the microstructure.
2.2 Reinitialisation procedure
The distance function must be reinitialized at each time step in order to keep the metric property ∥∇ψp∥ = 1 during all the simulation. Indeed, even if reinitialization is favourable for the regularity of the LS function, this treatment is especially crucial in order to verify that the capillarity effects are properly described by the diffusive part of equation (2). The classical approach used in [7–9] consists in solving a Hamilton-Jacobi (HJ) equation for each GLS function. This method corrects iteratively the LS functions until their respective metric properties are restored. Based on the resolution of a large number of partial differential equations systems, the HJ method can require a lot of iterations for achieving convergence. An efficient and parallel reinitialization algorithm based on a direct approach and using optimized searching procedures has been recently developed [10]. Based on the exact analytic reconstruction of the distance function, this method leads to significant computational cost reductions.
2.3 Recoloring algorithm
The numerical costs for solving equation (2) depend linearly on the number of GLS functions. The initial separation between grains belonging to the same GLS function must be chosen small enough to limit the computation time and sufficiently high to avoid a numerical coalescence (the grains belonging to the same GLS function can no longer be distinguished if they meet each other). To address this issue, an efficient grain recoloring algorithm has been recently developed [11], in order to handle dynamically the distribution of the grains inside the GLS functions. This methodology is composed of two major steps: (i) the separation of the connected components on the FE mesh and (ii) the swapping algorithm which detects the risk of coalescence and reassigns the grains in other GLS functions if needed.
2.4 Mesh adaptation
The model works in 2D and in 3D. Realistic predictions necessitate a sharp description of the interfaces. This issue is achieved thanks to an anisotropic mesh adaptation around the interfaces (Fig. 1). As the interface moves, periodic remeshing is performed such that the refinement zone always coincides with the interface position. This technique allows improving precision and reducing computation times in 2D.
 |
Fig. 1 Polycrystal description in 3D with the used finite element mesh (anisotropic meshing near grain boundaries). Représentation du polycristal 3D avec description du maillage éléments finis utilisés (maillage anisotrope près des joints de grains). |
3 Large-scale simulations
3.1 Generation of the initial polycrystal
Simulations are performed on a Representative Volume Element (RVE) at the mesoscopic scale where the microstructural features are explicitly represented. The polycrystal is constructed respecting the topological characteristics of the grains and the metallurgical properties. The RVE can be generated from a pure experimental description (by using experimental micrographs for example) or from a statistical method. For the latter, efficient high density packing algorithms have been developed to respect a given grain size distribution [12,13] (see Fig. 2). Boundary conditions applied to the RVE are representative of what suffered a material point at the macroscopic scale (thermomechanical cycle of the point considered).
Different 2D and 3D large-scale simulations enabled by the new major developments described previously, and which would not have been performed in acceptable computation times before, are illustrated below.
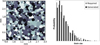 |
Fig. 2 2D RVE generation (500 grains) (left) respecting a given grain size distribution (right). (à gauche) Génération d’un volume élémentaire représentatif (VER) 2D (500 grains) et (à droite) description de la distribution de taille de grains respectée. |
3.2 Pure grain growth
In case of pure grain growth, the convective term of equation (2) vanishes and microstructural evolution is only driven by GBs mean curvature. Figures 3 and 4 represent the microstructural evolution of a 304 L austenitic stainless steel subjected to an isothermal heat treatment at 1050 °C. Simulations are performed respectively on a 2D and a 3D polycrystal. In both cases, the microstructural evolution is only driven by the reduction of the total GBs length/area. With isotropic GB mobility and energy, the well-known Burke and Turnbull equation [14] is used to validate the results obtained through these full field simulations. The comparison is plotted on Figure 3 showing a good agreement between both models.
 |
Fig. 3 (a) Initial 304 L 2D polycrystal (50000 grains); (b) Microstructural evolution during an isothermal heat treatment (1050 °C): comparison with the Burke and Turnbull model [11,14]. (a) Polycristal 2D initial − 304 L (50000 grains) ; (b) Évolution de la microstructure durant un traitement isotherme à 1050 °C : comparaison avec le modèle de Burke and Turnbull [11,14]. |
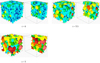 |
Fig. 4 3D microstructural evolution of a 304 L steel (grain growth simulation, the initial polycrystal contains 1700 grains). Modélisation d’un cas de croissance de grains en 3D − acier 304 L. Le polycristal initial est constitué de 1700 grains. |
3.3 Smith-Zener pinning (SZP) phenomenon
In order to limit the final grain size which can be detrimental for the mechanical properties, a classical method consists in precipitating second phase particles (SPP). These particles hinder the GB motion thanks to the dragging force exerted on GBs. The LS method is particularly interesting for the modeling of SZP [15] since no assumption is required concerning the shape or the dragging force exerted by the SPP. The interaction angle α between the GB and a precipitate is dictated by the balance of the surface tensions according to  , where
  ,
,  and γ are respectively the surface energies associated with the interfaces
  ,
,  and Γ12 (Fig. 5(a)). This constraint can be simply imposed by the mean of a boundary condition in the considered LS framework:
 (3)
(3)
When a GB passes through a particle, its shape thus adapts to satisfy equation (3), which modifies its local curvature and therefore its kinetic. If this approach is usually efficient, under specific conditions, abnormal grain growth (AGG) may occur. AGG can be described as the selective growth of only a few grains while other grains do not grow in the microstructure. It may occur as a result of a heterogeneous stored energy field leading to a driving force for some grain boundaries that overcomes the SZP force, or as a result of GB energy anisotropy, or as a result of a heterogeneous SPP distribution. The development of efficient and accurate modeling tools able to account for the SZP phenomenon is thus necessary.
Based on the work described in [9], the recent numerical developments [10,11] allowed performing 2D and 3D simulations as shown in Figures 6 and 7. SPP are considered inert and are represented as holes in the FE mesh (white disks in Fig. 5(b), black disks in Fig. 6(a) and green spheres in Fig. 7) [16]. In such a way, incoherent or coherent particle/grain interfaces can be considered through appropriate boundary conditions and the dragging effect is naturally modeled by the modification of the local curvature when the GB passes through the particles.
Figure 6 shows an example of 2D simulations performed with the DIGIMU® software. An isothermal treatment at 985 °C during 30 min is applied on an Inconel® 718 superalloy. At this temperature, the alloy contains δ precipitates at thermodynamic equilibrium, considered as SPP in the simulation. A two-dimensional RVE composed of 800 grains of γ phase is generated with a mean grain size of 8 μm (Fig. 6(a)). One percent surface fraction of δ phase is considered with a mean particle size of 400 nm. The mean grain size evolution during the isothermal treatment is plotted Figure 6(b). In order to evaluate the strong dragging effect exerted by SPP on GBs, results of a similar simulation without adding SPP in the RVE are also plotted.
The full field approach described here has also been applied to the modeling of static [17,18] and dynamic [19] recrystallization. In that case, the driving force for grain boundaries motion is given by both grain boundaries mean curvature and stored energy gradients between neighbouring grains (recrystallized or non-recrystallized). Preferential sites for nucleation of newly recrystallized grains can also be controlled by a suitable choice of nucleation criteria (topological and/or stored energy based).
 |
Fig. 5 (a) Scheme illustrating the SPP/GB interaction; (b) View of a FE mesh used for the Smith-Zener pinning simulations. The voids in the mesh (white disks) represent the SPP [16]. (a) Schéma illustrant l’interaction entre une particule de seconde phase (PSP) et un joint de grain; (b) description du maillage utilisé pour la simulation avec prise en compte des PSP (décrites par les disques blancs dans le maillage [16]). |
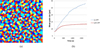 |
Fig. 6 (a) 2D RVE composed of 800 grains (mean grain size of 8 μm) and 1% surface fraction SPP (mean particles radius of 400 nm); (b) grain size evolution with and without SPP considering an Inconel® 718 alloy held at 985 °C during 30 min calculated by the DIGIMU® software. (a) VER 2D composé de 800 grains (rayon moyen des grains en nombre de 8 μm) et 1 % de fraction surfacique de PSP (rayon moyen des particules en nombre de 0.4 μm) ; (b) évolution de la taille de grain moyenne avec et sans prise en compte des PSP pour un matériau de type Inconel® 718 soumis à un traitement thermique de 30 min à 985 °C. Simulation réalisée avec le logiciel DIGIMU®. |
 |
Fig. 7 A 3D grain growth simulation for Inconel® 718. The green spheres represent the precipitates. Simulation 3D d’un cas de croissance de grains pour de l’Inconel® 718. Les sphères vertes correspondent aux PSP. |
4 Conclusion
A full field approach using the LS method in a FE context has been used to simulate the microstructural evolution during thermal treatments. Modeling at the mesoscopic scale can be a help for understanding complex microstructural phenomena but it can also be used to optimize/calibrate higher scale models (like mean field models [16,20]). These simulations allow describing in a natural way the materials in terms of microstructural features. The recent improvements done to reduce the high computation times generally associated with these models make possible now their use for industrial applications through the DIGIMU® software.
Acknowledgments
The authors thank the Framatome, ArcelorMittal, ASCOMETAL, AUBERT & DUVAL, CEA, SAFRAN, TIMET and Constellium companies and the ANR for their financial support through the DIGIMU consortium and ANR industrial Chair.
References
- P. Bernard, S. Bag, K. Huang, R.E. Logé, A two-site mean field model of discontinuous dynamic recrystallization, Mat. Sci. Eng. A 528, 7357 (2011) [CrossRef] [Google Scholar]
- M. Mukherjee, U. Prahl, W. Bleck, Modelling of microstructure and flow stress evolution during hot forging, Steel Res. Int. 81, 1102 (2010) [CrossRef] [Google Scholar]
- A.D. Rollett, D. Raabe, A hybrid model for mesoscopic simulation of recrystallization, Comp. Mater. Sci. 21, 69 (2001) [CrossRef] [Google Scholar]
- K. Piękoś, J. Tarasiuk, K. Wierzbanowski, B. Bacroix, Generalized Vertex Model-Study of recrystallization in copper, Mater. Sci. Forum 558-559, 1157 (2007) [CrossRef] [Google Scholar]
- L.Q. Chen, Phase-field models for microstructure evolution, Ann. Rev. Mater. Res. 32, 113 (2002) [CrossRef] [Google Scholar]
- M. Bernacki, H. Resk, T. Coupez, R.E. Logé, Finite element model of primary recrystallization in polycrystalline aggregates using a level set framework. Mod. Sim. Mat. Sci. Eng. 17, 064006 (2009) [CrossRef] [Google Scholar]
- M. Bernacki, R.E. Logé, T. Coupez, Level set framework for the finite-element modelling of recrystal- lization and grain growth in polycrystalline materials, Scr. Mat. 64, 525 (2011) [CrossRef] [Google Scholar]
- A.L. Cruz-Fabiano, R. Logé, M. Bernacki, Assessment of simplified 2D grain growth models from numerical experiments based on a level set framework, Comp. Mat. Sci. 92, 305 (2014) [CrossRef] [Google Scholar]
- A. Agnoli, N. Bozzolo, R.E. Logé, J.-M. Franchet, J. Laigo, M. Bernacki, Development of a level set methodology to simulate grain growth in the presence of real secondary phase particles and stored energy- application to a nickel-base superalloy, Comp. Mat. Sci. 89, 233 (2014) [CrossRef] [Google Scholar]
- M. Shakoor, B. Scholtes, P.-O. Bouchard, M. Bernacki, An efficient and parallel level set reinitialization method-application to micromechanics and microstructural evolutions, App. Math. Mod. 39, 7291 (2015) [CrossRef] [Google Scholar]
- B. Scholtes, M. Shakoor, A. Settefrati, P.-O. Bouchard, N. Bozzolo, M. Bernacki, New finite element developments for the full field modeling of microstructural evolutions using the level-set method, Comp. Mat. Sci. 109, 388 (2015) [CrossRef] [Google Scholar]
- K. Hitti, P. Laure, T. Coupez, L. Silva, M. Bernacki, Precise generation of complex statistical representative volume elements (RVEs) in a finite element context, Comp. Mat. Sci. 61, 224 (2012) [CrossRef] [Google Scholar]
- K. Hitti, M. Bernacki, Optimized Dropping and Rolling (ODR) method for packing of polydisperse spheres, App. Math. Model. 37, 5715 (2013) [CrossRef] [Google Scholar]
- J.E. Burke, D. Turnbull, Recrystallization and grain growth, Prog. in Met. Phys. 3, 220 (1952) [CrossRef] [Google Scholar]
- C. Zener, C.S. Smith, Grains, Phases and interfaces interpretation of microstructures, Trans. AIME 175, 15 (1948). [Google Scholar]
- B. Scholtes, D. Ilin, A. Settefrati, N. Bozzolo, A. Agnoli, M. Bernacki, Full field modeling of the Zener pinning phenomenon in a level set framework − discussion of classical limiting mean grain size equation, Superalloys 2016: Proceedings of the 13th International Symposium on Superalloys, 2016, pp. 497–503. [Google Scholar]
- B. Scholtes, R. Boulais-Sinou, A. Settefrati, D. Pino Muñoz, I. Poitrault, A. Montouchet, N. Bozzolo, M. Bernacki, 3D level set modeling of static recrystallization considering stored energy fields, Comp. Mater. Sci. 122, 57 (2016) [CrossRef] [Google Scholar]
- D.N. Ilin, N. Bozzolo, T. Toulorge, M. Bernacki. Full field modeling of recrystallization: Effect of intragranular strain gradients on grain boundary shape and kinetics. Comp. Mater. Sci. 150, 149 (2018) [CrossRef] [Google Scholar]
- L. Maire, B. Scholtes, C. Moussa, N. Bozzolo, D. Pino Muñoz, A. Settefrati, M. Bernacki, Modeling of dynamic and post-dynamic recrystallization by coupling a full field approach to phenomenological laws, Materials & Design 133, 498 (2017) [CrossRef] [Google Scholar]
- L. Maire, J. Fausty, M. Bernacki, N. Bozzolo, P. De Micheli, C. Moussa. A new topological approach for the mean field modeling of dynamic recrystallization. Materials & Design 146, 194 (2018) [CrossRef] [Google Scholar]
Cite this article as: Amico Settefrati, Pascal de Micheli, Ludovic Maire, Benjamin Scholtes, Nathalie Bozzolo, Charbel Moussa, Etienne Perchat, Marc Bernacki, Prediction of the grain size evolution during thermal treatments at the mesoscopic scale: a numerical framework and industrial examples, Matériaux & Techniques 106, 105 (2018)
All Figures
|
Fig. 1 Polycrystal description in 3D with the used finite element mesh (anisotropic meshing near grain boundaries). Représentation du polycristal 3D avec description du maillage éléments finis utilisés (maillage anisotrope près des joints de grains). |
| In the text | |
|
Fig. 2 2D RVE generation (500 grains) (left) respecting a given grain size distribution (right). (à gauche) Génération d’un volume élémentaire représentatif (VER) 2D (500 grains) et (à droite) description de la distribution de taille de grains respectée. |
| In the text | |
|
Fig. 3 (a) Initial 304 L 2D polycrystal (50000 grains); (b) Microstructural evolution during an isothermal heat treatment (1050 °C): comparison with the Burke and Turnbull model [11,14]. (a) Polycristal 2D initial − 304 L (50000 grains) ; (b) Évolution de la microstructure durant un traitement isotherme à 1050 °C : comparaison avec le modèle de Burke and Turnbull [11,14]. |
| In the text | |
|
Fig. 4 3D microstructural evolution of a 304 L steel (grain growth simulation, the initial polycrystal contains 1700 grains). Modélisation d’un cas de croissance de grains en 3D − acier 304 L. Le polycristal initial est constitué de 1700 grains. |
| In the text | |
|
Fig. 5 (a) Scheme illustrating the SPP/GB interaction; (b) View of a FE mesh used for the Smith-Zener pinning simulations. The voids in the mesh (white disks) represent the SPP [16]. (a) Schéma illustrant l’interaction entre une particule de seconde phase (PSP) et un joint de grain; (b) description du maillage utilisé pour la simulation avec prise en compte des PSP (décrites par les disques blancs dans le maillage [16]). |
| In the text | |
|
Fig. 6 (a) 2D RVE composed of 800 grains (mean grain size of 8 μm) and 1% surface fraction SPP (mean particles radius of 400 nm); (b) grain size evolution with and without SPP considering an Inconel® 718 alloy held at 985 °C during 30 min calculated by the DIGIMU® software. (a) VER 2D composé de 800 grains (rayon moyen des grains en nombre de 8 μm) et 1 % de fraction surfacique de PSP (rayon moyen des particules en nombre de 0.4 μm) ; (b) évolution de la taille de grain moyenne avec et sans prise en compte des PSP pour un matériau de type Inconel® 718 soumis à un traitement thermique de 30 min à 985 °C. Simulation réalisée avec le logiciel DIGIMU®. |
| In the text | |
|
Fig. 7 A 3D grain growth simulation for Inconel® 718. The green spheres represent the precipitates. Simulation 3D d’un cas de croissance de grains pour de l’Inconel® 718. Les sphères vertes correspondent aux PSP. |
| In the text | |
Current usage metrics show cumulative count of Article Views (full-text article views including HTML views, PDF and ePub downloads, according to the available data) and Abstracts Views on Vision4Press platform.
Data correspond to usage on the plateform after 2015. The current usage metrics is available 48-96 hours after online publication and is updated daily on week days.
Initial download of the metrics may take a while.