")
")
| Issue |
Matériaux & Techniques
Volume 111, Number 4, 2023
Special Issue on ‘Indentation advances in experiments and modelling’, edited by Florian Lacroix, Olga Smerdova and Eric Le Bourhis
|
|
|---|---|---|
| Article Number | 402 | |
| Number of page(s) | 9 | |
| Section | Metals and alloys | |
| DOI | https://doi.org/10.1051/mattech/2023021 | |
| Published online | 06 October 2023 | |
Original Article
Mechanical properties of stainless steel by using high temperature microhardness tester
Propriétés mécaniques de l’acier inoxydable déterminées par microdureté à haute température
DMAS, ONERA, Université Paris Saclay, 29 avenue de la division Leclerc, 92322 Chatillon Cedex, France
* e-mail: This email address is being protected from spambots. You need JavaScript enabled to view it.
Received:
22
June
2023
Accepted:
11
July
2023
Abstract
In the aeronautical field, materials are used in severe environmental conditions (temperature, atmosphere), particularly for engine applications. In order to qualify new alloys compositions, ONERA is developing micromechanical characterization means to carry out indentation tests from room temperature up to 700 °C under conditions close to operating conditions. This method presents the interest of performing tests faster than classical mechanical tests like tensile or bending tests under severe conditions and with small amounts of materials. In order to carry out screening tests, a 316L stainless steel is studied and the evolution of hot Vickers hardness properties and yield stress versus temperature are presented. By increasing the applied load from 0.1 to 20 N, we show that we can neglect surface microstructural changes or possible contamination of the sample surface by oxidation. We show that from 0.5 N, the hardness measurement is independent of load on 316L stainless steel. By using Tabor’s law to express the mechanical resistance, we show that the hardness decreases by 50% when the test temperature goes from 20 to 700 °C, which is close to the supplier’s values. A discussion on the use of indentation to determine mechanical resistance and the limitations of this technique is presented. In perspective, these measurements could be carried out at 1000 °C and on many different materials such as layers, coatings, composite materials, brazing cords or additive manufacturing materials.
Résumé
Dans le domaine aéronautique, les matériaux sont utilisés dans des conditions environnementales sévères (température, atmosphère), notamment pour les applications moteurs. Afin de qualifier de nouvelles compositions d’alliages, l’ONERA développe des moyens de caractérisation micromécanique permettant de réaliser des essais d’indentation allant de la température ambiante jusqu’à 700 °C dans des conditions proches des conditions opératoires. Cette méthode présente l’intérêt de réaliser des essais plus rapidement que les essais mécaniques classiques comme les essais de traction ou de flexion dans des conditions sévères et avec de petites quantités de matériaux. Afin de réaliser des tests en série, un acier inoxydable 316L est étudié et l’évolution des propriétés de dureté Vickers à chaud et de la résistance mécanique en fonction de la température sont présentées. En augmentant la charge appliquée de 0,1 à 20 N, nous montrons que nous pouvons négliger les changements microstructuraux de surface ou une éventuelle contamination de la surface de l’échantillon par oxydation. Nous montrons qu’à partir de 0,5 N, la mesure de dureté est indépendante de la charge sur l’inox 316L. En utilisant la loi de Tabor pour exprimer la résistance mécanique, nous montrons que la dureté diminue de 50 % lorsque la température d’essai passe de 20 à 700 °C, ce qui est proche des valeurs du fournisseur. Une discussion sur l’utilisation de l’indentation pour déterminer la résistance mécanique et les limitations de cette technique est présentée. En perspective ces mesures pourraient être effectuées à 1000 °C et sur de nombreux matériaux différents tels que des couches, des revêtements, des matériaux composites, des cordons de brasage ou des matériaux de fabrication additive.
Key words: high temperature / microhardness / stainless steel / superalloy / mechanical resistance
Mots clés : haute température / microdureté / acier inoxydable / superalliage / résistance mécanique
© B. Passilly et al., 2023
 This is an Open Access article distributed under the terms of the Creative Commons Attribution License (https://creativecommons.org/licenses/by/4.0), which permits unrestricted use, distribution, and reproduction in any medium, provided the original work is properly cited.
1 Introduction
The development of the aerospace industry during the last century led to elaborate new materials to increase aircraft performances [1]. These new metal alloys will be used for many aircraft parts such as turbomachines because of their resistance to harsh environments (high temperature, high stress, corrosion).
To predict mechanical behavior and life duration of these aeronautical parts, it is essential to test them in severe thermal conditions. However, the study of the behavior of materials at temperature is complex. Problems of system temperature stability, oxidation or aging of the sample, or even degradation of the equipment are encountered to develop such mechanical tests. In particular, mechanical tests at very high temperature such as tensile and bending require heavy and expensive equipment, tedious preparation of specimens as well as long test periods.
In order to develop hot materials and new compositions of alloys, and to accelerate research on new superalloys for turbomachinery parts a means of measuring hardness at high temperature is presented. With this new instrument, a temperature of 1000 °C and a load of 30 N will be achievable. Thus, the use of conventional mechanical tests will be minimized.
A known metal alloy stainless steel 316L is tested up to 700 °C under a maximum load of 20 N. The aim of this work is to determine hardness and mechanical resistance [2] of this alloy, when the temperature test is increasing and to discuss the results with different parameters as load and temperature test.
2 Samples preparation
The indentation technique requires the studied material to be perfectly flat and its surface to be clean. The preparation ensures that the indentations are symmetrical, i.e. the measurements of the two diagonals are the same length. The samples must therefore be polished beforehand, which can be complex for the hardest materials. For this work, the sample is polished to a grain of ¼ μm with diamond paste. In addition, the dimensions of the sample must allow its insertion in the sample holder. As part of this work, the sample is a 6 × 5 × 10 mm parallelepiped and the polished face is the 6 × 10 mm.
316L stainless steel is the material chosen for the development phase of the equipment. The composition of the 316L stainless steel sample (Comptoir Général des Métaux) is given in Table 1.
The presence of manganese, nickel, molybdenum and chromium gives the material good corrosion resistance. In addition, molybdenum gives 316L stainless steel good mechanical properties, especially at high temperatures. This is why this steel is used for applications in areas such as construction and transport [3,4].
Chemical composition of stainless steel 316L.
Composition chimique de l’acier inoxydable 316L.
3 High temperature hardness test
3.1 High temperature hardness apparatus
The high temperature micro hardness device shown in Figure 1 used for this study is a prototype developed by ONERA. It uses the same functioning principles as commercial nanoindentation devices. The load P applied on the sample by the indenter, temperature and displacement are recorded during the indentation tests.
The hot micro-hardening means consists of the elements shown in Figure 2. Indenter displacement is controlled by a motorized displacement table. Both the indenter and the sample are separately heated by cylindrical furnaces, thus preventing any thermal gradient and drift upon contact between the indenter and the studied specimen [5]. The furnaces are able to reach 1000 °C (Fig. 3). These furnaces consist in a ceramic cylinder on which a platinum wire is rolled up. A K thermocouple is fixed in the oven near the sample to control and regulate the temperature during the tests to ± 1 °C. To minimize heat radiation to other components, a protective screen (17 in Fig. 4) is placed around the ovens which are cooled by a thermostatically controlled water circuit (16 in Fig. 4).
An access door located on the front of the device (6 in Fig. 2) allows the sample to be introduced into the chamber, which is then vacuumed (< 5.10−6 mbar) for high-temperature tests. The motorized tilting platform (9 in Fig. 2) is used to rotate the sample holder by 90° then the Y axis allows the sample (7 in Fig. 2) to approach the access door (Figs. 5 and 6).
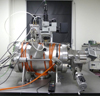 |
Fig. 1 High temperature micro hardness prototype developed by ONERA. Prototype de microdureté à haute température développé par l’ONERA. |
 |
Fig. 2 Diagram of the main components of the hot indentation apparatus. Schéma des principaux composants de l’appareil d’indentation à chaud. |
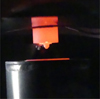 |
Fig. 3 Furnace of the indenter at 750 °C. Four de l’indenteur à 750 °C. |
 |
Fig. 4 Furnace and indenter installed on the cooling flange. Four et indenteur installés sur la bride de refroidissement. |
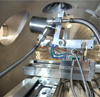 |
Fig. 5 Tilting of sample holder and furnace. Inclinaison du porte-échantillon et du four. |
 |
Fig. 6 Interior of the vacuum chamber. Intérieur de la chambre à vide. |
3.2 Indenter choice
Vickers hardness consists in applying a diamond indenter to the material to be characterized. At room temperature, diamond is extremely hard and inert, allowing any material to be indented without risk of damage or deformation of the indenter, or chemical reaction with the surface. On the other hand, diamond is not suitable for hardness measurements at high temperatures. Indeed, from 400 °C, the diamond oxidizes to form carbon oxide and carbon dioxide [6–8]. Furthermore, the hardness of diamond decreases faster at high temperature than other materials, as shown in Figure 7. Sapphire (Al2O3) seems to be resistant to high temperature oxidation. In addition, according to the same figure, the hardness of sapphire decreases gradually and slowly up to 1000 °C. However, sapphire is likely to react with the study material [8,9]. It is therefore necessary to ensure that the composition of the alloy is compatible with the use of a sapphire tip. The Vickers sapphire tip (Microstar Technologies, United States) is set on a support, itself screwed onto a tip holder.
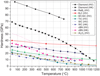 |
Fig. 7 Hardness of different materials that can be used as an indenter as a function of temperature [9]. Dureté de différents matériaux pouvant être utilisés comme indenteur en fonction de la température [9]. |
3.3 Measurements
The load sensor (LCM201-100 N, Omega) used to measure the load applied to the sample is located outside the vacuum chamber to avoid sensor heating, cable routing, incorrect centering of the measured load. The movement is transmitted to the indenter by a bellow which is compressed when the table is moving to imprint the sample.
The optical microscope (12 in Fig. 2) is fixed on a motorized displacement table along the z axis (M-UTMPP1HL, Newport) outside the vacuum chamber to avoid exposing the lenses to high temperatures. In order to bring the objective close enough to the specimen during focusing, a cooled porthole is installed and long working distance objectives are used. The measurement of diameter of the imprints are carried out by these objectives.
3.4 Pressure and vacuum conditions
The evolution of the pressure in the vacuum chamber during the various stages of vacuuming is illustrated in Figure 8. The pressure is measured using a pressure sensor (AHC1010, Alcatel).
Different regimes are observable. First, the pumping performed by the primary pump (ACP 28 Alcatel) slowly decreases the pressure, which tends towards a plateau at 10−2 mbar. Then, the start of the turbomolecular pump (ACP 400 Alcatel) causes a drop-in pressure to a plateau at around 10−5 mbar. An increase in pressure is observed during turbomolecular pumping. This is due to the heating of the walls (40 to 50 °C) which leads to the desorption of the molecules. The pressure stabilizes around 10−5 mbar when the impurities are removed. The parts closed to the furnaces and sensors are cooled at 20 ± 0.1 °C by a thermostatically controlled water circuit to prevent expanding and damaging (T257P, Thermotech).
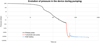 |
Fig. 8 Evolution of the pressure in the device versus time, in logarithmic scale. Évolution de la pression dans le prototype en fonction du temps, en échelle logarithmique. |
3.5 Principle of the hardness test
During microhardening, the load applied is measured as a function of the displacement of the indenter in the material. This produces an indentation curve like the one shown in Figure 9. Multiple indenter tip shapes can be used to measure hardness values of studied materials. Usual geometries include Berkovitch indenter (a three-sided pyramid), Brinell indenter (a spherical tip), and Vickers indenter (a square-based pyramid tip). In metalworking industry, Vickers indenter is preferentially used. Moreover, Vickers indenter is used in order to compare more easily the hardness value of a commercial Vickers hardness tester (MicroMet5104, Buehler) with our device.
Vickers hardness is calculated from the imprint left in the material and not from the load-unload curve. The equation (1) is used, where P is the load expressed in Newtons and d is the average of the diagonals of the indentation expressed in millimeters:
 (1)
(1)
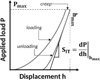 |
Fig. 9 Schematic graph presenting the multiple phases of the loading cycle during indentation tests [10]. Graphique schématique présentant les différentes phases du cycle de charge lors d’un essai d’indentation [10]. |
3.6 Course of a test
Each hot hardness test begins with the introduction of the sample and then with the purge of the vacuum chamber. When high vacuum (10−5 mbar) is established, in order to limit the presence of oxygen in the vacuum chamber, hydrogenated argon (3%) is introduced until a slight overpressure of 0.1 bar is reached in order to limit any entry of air into the enclosure and to check that there are no leaks. For tests at very high temperature, the equipment is purged several times. Before heating, the cooling circuit is put into operation and the heating ramp is set at 50 °C/min. This procedure takes around 120 minutes.
The two furnaces were tested to ensure that they were well regulated (low overshoot of up to 2 °C of the set temperature) to minimize any thermal drift problems.
Once the ovens are heated and stabilized in temperature (30 minutes), the program developed under @LabVIEW is launched. The sample is automatically brought under the microscope and focusing on the sample is performed. Then, the surface of the sample is scanned to choose the area to indent. For each impression to be made, the position, the load to be applied and the dwell time are entered in the program. The sample then moves from the position under the microscope to the position under the tip.
During indentation testing, the exact measurement of the applied load is essential for the calculation of hardness (see Eq. (1)). Moreover, the fragile nature of the indenter requires avoiding sudden increases in mechanical and thermal stresses of the tip during indentation. This is why the penetration of the indenter into the material must be slow and regular [11].
The position of the contact point during indentation varies when the temperature increases. It is therefore necessary to determine this position at the start of each series of tests at a given temperature. For this, a test is carried out during the first indentation of each series.
At the beginning, the descent of the indenter doesn’t encounter any obstacle so the force sensor only measures the compression force of the bellows. When the tip comes into contact with the sample, the measured force increases sharply. Therefore, the point of contact is determined from the sudden change in force measured by the sensor. Figure 10 represents the typical curves of the evolution of the force as a function of time for a typical indentation test.
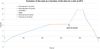 |
Fig. 10 Evolution of the load as a function of the time for a test at 20 °C. Évolution de la charge en fonction du temps pour un essai à 20 °C. |
4 High temperature mechanical properties of stainless steel
4.1 Hardness properties from room temperature to 700 °C
The study of the hardness of 316L stainless steel was carried out following the protocol in 2.6. The first tests of hardness versus applied load were carried out at room temperature (see example of imprint in Fig. 11). The hardness results are collated in Figure 12. A commercial Vickers indentation device (MicroMet5104, Buelher) is used to perform tests at room temperature up to 9.8 N. These results are compared with those obtained with the new indentation instrument under the same conditions in order to calibrate hardness. The values of the developed instrument coincide with the values of the commercial instrument (Fig. 12).
The hardness is constant and independent of the load when the load is higher than 4.9 N, while the lower the load, the more important the values become. Therefore, the loads applied during the high temperature tests are established at 4.9 N, 9.8 N and 14.7 N for each temperature tested. Each test is repeated three times in order to reduce the uncertainties on the results. The hardness results from 20 to 700 °C are presented in Figure 13. As expected, the hardness of steel decreases with increasing temperature. Three regimes are noticed: a pronounced decrease is noticed before 200 °C then a slow regime is observed between 200 and 500 °C and another pronounced decrease is noticed after 500 °C. Moreover, the dispersion of the hardness values at different loads and for each temperature is not significative, which attests to the high repeatability of the results.
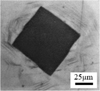 |
Fig. 11 Vickers imprint on 316L sample. Empreinte Vickers sur l’échantillon 316L. |
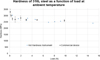 |
Fig. 12 Hardness of 316L steel as a function of load at room temperature. Dureté de l’acier 316L en fonction de la charge à température ambiante. |
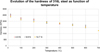 |
Fig. 13 Hardness of 316L steel as a function of temperature. Dureté de l’acier 316L en fonction de la température. |
4.2 Mechanical resistance from room temperature to 700 °C
In order to compare the experimental data and the data from the literature, it is necessary to convert the hardness values into mechanical resistance with the relations of Tabor, written below [2]. (2)
(2)
In equation (2), Rm is the mechanical resistance (in MPa), Re is the elastic limit (in MPa) and Hv the Vickers hardness in (MPa). For Tabor’s relationship to be applicable, it must be ensured that the hardness is independent of the load at each temperature [2]. For this, the evolution of the hardness according to the load of three of the temperatures tested is presented in Figure 14. This graph shows that hardness is independent of load at any temperature. On the other hand, it has been shown that the correlation factor between hardness and mechanical strength is independent of temperature. Therefore, Tabor’s law can be applied to the results of Figure 13. The comparison between the values of the literature determined by tensile test and the results obtained is presented in Figure 15. It is observed that the experimental values are higher than the values from the literature [3]. This overestimation comes from the conversion of hardness into mechanical strength. Indeed, the proportionality factor established by Tabor is an average obtained after a study of different metallic materials (steel, aluminum, copper). Several studies carried out on 316 stainless steel have subsequently established that the correlation coefficient is between 2.64 and 3.67 for this material [12]. The proportionality factor between experimental values obtained and values from the literature is calculated. The result is 2.4 which is close to the lower limit from the literature. Figure 16 presents the normalization of the experimental values and the values taken from the literature.
Normalization makes it possible to compare the evolution of the shape of the curves. It is noted that the experimental mechanical resistance follows the same evolution as the values resulting from the literature. We can highlight the fact that the experimental results agree well with the theoretical values but that a corrective factor must be applied.
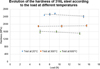 |
Fig. 14 Evolution of the hardness of 316L steel according to the load at different temperatures. Évolution de la dureté de l’acier 316L en fonction de la charge à différentes températures. |
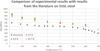 |
Fig. 15 Comparison of experimental results with results from the literature on 316L steel. Comparaison des résultats expérimentaux avec les résultats de la littérature sur l’acier 316L. |
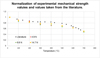 |
Fig. 16 Normalization of experimental mechanical strength values and values taken from the literature. Normalisation des valeurs expérimentales de résistance mécanique avec les valeurs de la littérature. |
5 Conclusion
During this work, the hot indentation mean has been used to determine hot hardness values carried out on a sample of 316L stainless steel up to 700 °C. This test is useful for determining the evolution of the hardness of this material according to the temperature and the applied load. Thus, it has been established that the decrease in hardness of 316L when the temperature increases occurs in three distinct regimes. Furthermore, the repeatability of the results is demonstrated by the low dispersion of the measured values. The experimental values overestimate the values taken from the literature, which may be due to a difference in the study conditions.
Compared to traditional mechanical tests such as tensile tests, hot hardness instrument allows a large number of high temperature tests to be carried out in record time. In addition, this type of test is non-destructive and requires a small amount of material and short sample preparation. Microhardness is therefore a characterization technique to determine the mechanical properties of a material. In addition, microhardness is a technique to access the local characteristics of a material. This is why this instrument will be useful for the analysis of diffusion couples.
Acknowledgments
Acknowledgement. The work presented in this paper was carried out thanks to the financial support of SAFRAN group and French Ministry of the Armed Forces, Defence Innovation Agency within the framework of the ADAMANT chair (Acceleration of the Development of Alloys and Multilayer Systems for Applications to New Turbines).
References
- P. Caron, T. Khan, Evolution of Ni-based superalloys for single crystal gas turbine blade applications, Aerosp. Sci. Technol. 3, 513–523 (1999), https://doi.org/10.1016/s1270-9638(99)00108-x [CrossRef] [Google Scholar]
- D. Tabor, The physical meaning of indentation and scratch hardness, Br. J. Appl Phys. 7, 159–166 (1956), https://doi.org/10.1088/0508-3443/7/5/301 [CrossRef] [Google Scholar]
- Data sheet: Stainless 316, 316L, 317, 317L. (s.d.), in: United performance metals (1.888.282.3292) [Google Scholar]
- Fiche technique : acier inoxydable austénitique nuance 316L (s.d.), in: APERAM [Google Scholar]
- J.M. Wheeler, D.E.J. Armstrong, W. Heinz, et al., High temperature nanoindentation: The State-of-the-art and future challenges, Curr. Opin. Solid State Mater. Sci. 19, 354–366 (2015), https://doi.org/10.1016/j.cossms.2015.02.002 [CrossRef] [Google Scholar]
- X. Liu, Développement de la caractérisation du comportement local à haute température des alliages métalliques par micro indentation, Thèse de doctorat à l’Université de Technologie de Compiègne, 2017. [Google Scholar]
- J.M. Wheeler, R.A. Oliver, T.W. Clyne, AFM Observation of diamond indenters after oxidation at elevated temperatures, Diam. Relat. Mater. 19, 1348–1353 (2010), https://doi.org/10.1016/j.diamond.2010.07.004 [CrossRef] [Google Scholar]
- B. Passilly, M. Bejet, Tip indenting apparatus for testing a block of material, US 08181506, 2012. [Google Scholar]
- J.M. Wheeler, J. Michler, Indenter materials for high temperature nanoindentation, Rev. Sci. Instrum. 84, 101–301 (2013) [Google Scholar]
- B. Passilly, R. Delannoy, Characterization of the ageing of an epoxy resin using high temperature, nanoindentation, Matériaux & Techniques 107, 206 (2019), https://doi.org/10.1051/mattech/2019004 [CrossRef] [EDP Sciences] [Google Scholar]
- B. Passilly, L. Molenda, Hot hardness measurements on material sup to 600 °C during the first hour of using, Acta Polytech. CTU Proc. 27, 160–163 (2020), https://doi.org/10.14311/APP.2020.27.0160 [CrossRef] [Google Scholar]
- J.T. Busby, M.C. Hash, G.S. Was, The relationship between hardness and yield stress in irradiated austenitic and ferritic steels, J. Nucl. Mater. 336, 267–278 (2005), https://doi.org/10.1016/j.jnucmat.2004.09.024 [CrossRef] [Google Scholar]
Cite this article as: Bruno Passilly, Ariane Quelquejeu, Amélie Kardache, Mechanical properties of stainless steel by using high temperature microhardness tester, Matériaux & Techniques 111, 402 (2023)
All Tables
Chemical composition of stainless steel 316L.
Composition chimique de l’acier inoxydable 316L.
All Figures
|
Fig. 1 High temperature micro hardness prototype developed by ONERA. Prototype de microdureté à haute température développé par l’ONERA. |
| In the text | |
|
Fig. 2 Diagram of the main components of the hot indentation apparatus. Schéma des principaux composants de l’appareil d’indentation à chaud. |
| In the text | |
|
Fig. 3 Furnace of the indenter at 750 °C. Four de l’indenteur à 750 °C. |
| In the text | |
|
Fig. 4 Furnace and indenter installed on the cooling flange. Four et indenteur installés sur la bride de refroidissement. |
| In the text | |
|
Fig. 5 Tilting of sample holder and furnace. Inclinaison du porte-échantillon et du four. |
| In the text | |
|
Fig. 6 Interior of the vacuum chamber. Intérieur de la chambre à vide. |
| In the text | |
|
Fig. 7 Hardness of different materials that can be used as an indenter as a function of temperature [9]. Dureté de différents matériaux pouvant être utilisés comme indenteur en fonction de la température [9]. |
| In the text | |
|
Fig. 8 Evolution of the pressure in the device versus time, in logarithmic scale. Évolution de la pression dans le prototype en fonction du temps, en échelle logarithmique. |
| In the text | |
|
Fig. 9 Schematic graph presenting the multiple phases of the loading cycle during indentation tests [10]. Graphique schématique présentant les différentes phases du cycle de charge lors d’un essai d’indentation [10]. |
| In the text | |
|
Fig. 10 Evolution of the load as a function of the time for a test at 20 °C. Évolution de la charge en fonction du temps pour un essai à 20 °C. |
| In the text | |
|
Fig. 11 Vickers imprint on 316L sample. Empreinte Vickers sur l’échantillon 316L. |
| In the text | |
|
Fig. 12 Hardness of 316L steel as a function of load at room temperature. Dureté de l’acier 316L en fonction de la charge à température ambiante. |
| In the text | |
|
Fig. 13 Hardness of 316L steel as a function of temperature. Dureté de l’acier 316L en fonction de la température. |
| In the text | |
|
Fig. 14 Evolution of the hardness of 316L steel according to the load at different temperatures. Évolution de la dureté de l’acier 316L en fonction de la charge à différentes températures. |
| In the text | |
|
Fig. 15 Comparison of experimental results with results from the literature on 316L steel. Comparaison des résultats expérimentaux avec les résultats de la littérature sur l’acier 316L. |
| In the text | |
|
Fig. 16 Normalization of experimental mechanical strength values and values taken from the literature. Normalisation des valeurs expérimentales de résistance mécanique avec les valeurs de la littérature. |
| In the text | |
Current usage metrics show cumulative count of Article Views (full-text article views including HTML views, PDF and ePub downloads, according to the available data) and Abstracts Views on Vision4Press platform.
Data correspond to usage on the plateform after 2015. The current usage metrics is available 48-96 hours after online publication and is updated daily on week days.
Initial download of the metrics may take a while.