")
")
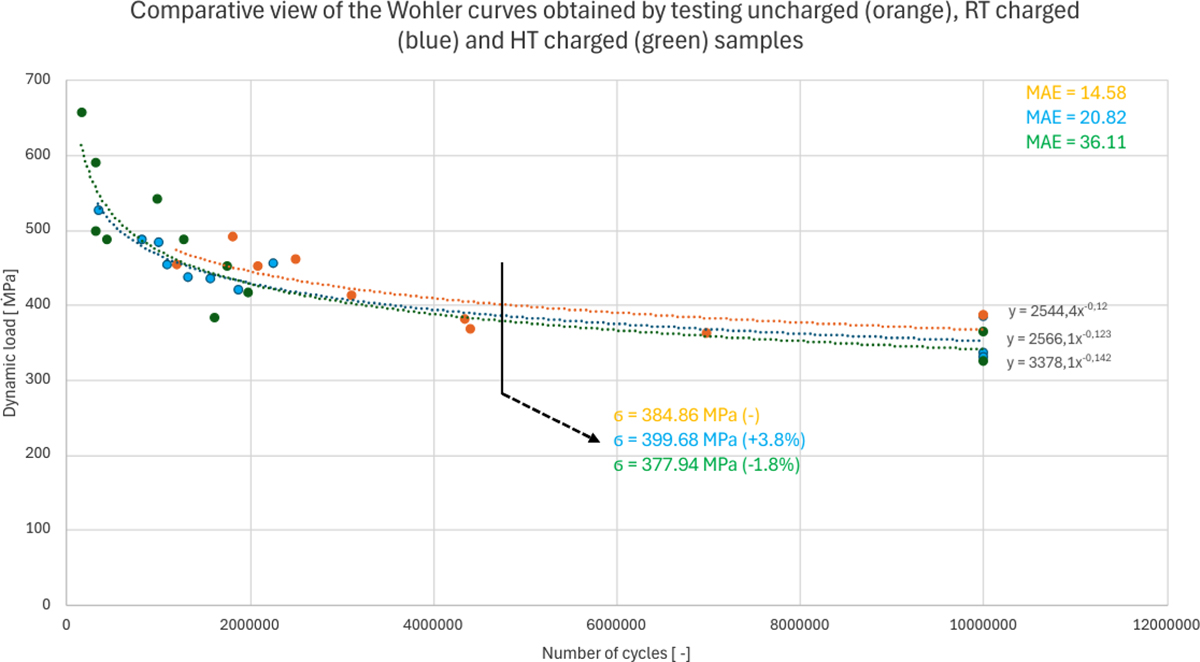
Fig. 4
Download original image
Comparative view of the extrapolated potential curves representing Wohler curves of uncharged (orange), RT charged (blue) and HT charged (green) samples of the Material 1. MAE ranges from 2.2 to 5.5% of the maximum nominal load. Numerical values of extrapolated load correspond to 5M cycles.
Current usage metrics show cumulative count of Article Views (full-text article views including HTML views, PDF and ePub downloads, according to the available data) and Abstracts Views on Vision4Press platform.
Data correspond to usage on the plateform after 2015. The current usage metrics is available 48-96 hours after online publication and is updated daily on week days.
Initial download of the metrics may take a while.