")
")
| Issue |
Matériaux & Techniques
Volume 113, Number 4, 2025
Special Issue on ‘Opportunities and Challenges of Hydrogen Use for Steelmaking Decarbonization’, edited by Ismael Matino, Valentina Colla and Akhilesh Swarnakar
|
|
|---|---|---|
| Article Number | 401 | |
| Number of page(s) | 10 | |
| Section | Ageing, durability and fatigue | |
| DOI | https://doi.org/10.1051/mattech/2025012 | |
| Published online | 29 October 2025 | |
Original Article
Study of hydrogen embrittlement in the green steelworks ‒ the case of the high temperature nickel-based alloys
1
Joanneum Research Forschungsgesellschaft mbH, Leobner Str. 94a, Niklasdorf 8712, Austria
2
ArcelorMittal Research, 57280 Maizières-lès-Metz, France
3
Fachhochschule Wiener Neustadt, Johannes-Gutenberg-Straße 3, 2700 Wiener Neustadt, Austria
* Corresponding author: This email address is being protected from spambots. You need JavaScript enabled to view it.
Received:
31
May
2025
Accepted:
12
September
2025
Abstract
This paper presents a study of exposure of two high-temperature Nickel-based alloys to a Hydrogen gas in flow. This study is performed within the EU Project “RecHycle”, aiming at construction of a prototype Hydrogen-driven steelwork. The aim of the study was to determine the effect of this exposure to the mechanical and metallurgical properties of the two materials in question and assess the effect of the transition of the steelworks from conventional fuel to green Hydrogen. The paper presents a full methodology of exposure, testing and analysis of the samples in the laboratory conditions, which was applied in this study. The main conclusions of the study report that the material in both cases has not experienced any detriment of critical mechanical and structural parameters after an exposure for a period of up to 48 h. The study recommends that further investigations in a relevant industrial environment are carried out, simulating the real load cycles of the future green steelworks.
Key words: hydrogen / embrittlement / nickel-based alloys / high temperature / green steelworks
These authors contributed equally to this work.
© K. Shickle et al., 2025
 This is an Open Access article distributed under the terms of the Creative Commons Attribution License (https://creativecommons.org/licenses/by/4.0), which permits unrestricted use, distribution, and reproduction in any medium, provided the original work is properly cited.
1 Introduction
The transition of European industry to green energy sources is driving many different research and innovation activities. In the framework of Green Transition, these are mainly focused on optimizing the consumption of existing fuels and on transition to sustainable energy sources used in industrial processes. One of the most interesting green fuels is hydrogen, due to its positive impact on the carbon footprint. Hydrogen is not without its challenges, especially when it comes to use in transport applications (effects such as flame attachment or flashback are still challenging [1]). But it is the most promising alternative to fossil fuels, especially for use in industrial plants such as steelworks. Energy use in industry is the largest source of CO2 emissions (24.2%), well ahead of transport, agriculture and even energy use in buildings, which supports the implementation of Hydrogen in steelworks and similar energy-intensive industries [2]. However, there are significant material challenges associated with the use of hydrogen in industrial facilities. Hydrogen is a highly volatile and reactive gas, which when in contact with the metallic material, generally reacts in one of two ways − either it infiltrates and positions itself at the grain boundary, taking the opportunity to accumulate, expand and promote cracking [3], or it reacts with the metallic material and produces brittle formation, most commonly hydrides [4]. In both cases, the associated phenomena lead to fragilization, commonly known as hydrogen embrittlement (HE). This is a detrimental effect that decreases the structural strength of material and leads to premature failure. In plants such as hydrogen-powered steelmaking, this would be a serious event as hydrogen is highly flammable and could cause tragic explosions.
The subject of this study are two Nickel-based high temperature alloys exposed to the Hydrogen gas at room and operating temperature. HE of Ni alloys has been the subject of much research. In general, several theories have been proposed to explain the HE phenomenon; most commonly, hydrogen-enhanced localized plasticity (HELP) [5], hydrogen-enhanced decohesion (HEDE) [6] and adsorption-induced dislocation emission (AIDE) [7] mechanisms are invoked to explain the observation of failure modes in Ni alloys that have failed in hydrogen environments. Dwivedi and Vishwakarma offer a complete review on hydrogen embrittlement in high-strength materials discussing its mechanisms, methods for measurement, and prevention strategies [8].
On the other side, many experimental studies have been conducted. Lecoester et al. [9] have probably been among first to investigate the basic mechanism of hydrogen translation through Inconel 600 by accelerated desorption of tritium from Alloy 600 at 293 K with tritiated tensile specimen by beta-counting during straining. Hou et al. [10] also studied the same alloy and its hydrogenization in oxygenated water. Most recently Li et al. studied In 600 in the electrochemical cell and found that the material exhibits hydrogen-induced loss in ductility such as elongation to failure and reduction in area for all hydrogen charging temperatures of 280K–330K. The most recent review of HE in Ni alloys [11] shows that HE effects in superalloys have been observed at broad temperature range. The review claims that HE susceptibility can vary significantly within each alloy system, and many of these superalloys have been identified as highly susceptible to hydrogen embrittlement based on the severity classification. The susceptibility to hydrogen embrittlement of two precipitation hardened nickel-based alloys, Alloy 718 and Alloy 725, has been investigated using slow strain rate tensile (SSRT) testing and advanced characterization techniques [12]. The mechanical properties and fracture behavior of these two alloys were compared in both hydrogen-free and hydrogen-charged conditions. In the presence of hydrogen, Alloy 718 failed predominantly by a combination of transgranular and intergranular cracking behavior, whereas Alloy 725 failed predominantly by intergranular failure with a much lower resistance to hydrogen embrittlement. The hydrogenation was carried out in a mixture of glycerol and H3PO4 for 18 h at a cathodic current density of 15 mA/cm2 at 75 °C. This study is an example of the predominant route which combines electrolytical charging procedure and tensile tests commonly at slow strain rate. Another recent study [13] explores the susceptibility to hydrogen embrittlement (HE) and the mechanisms of hydrogen-assisted cracking in nickel-based single crystal (SX) superalloys at 25 °C and 1000 °C using the electrochemical hydrogen pre-charging technique. The decrease in HE susceptibility at elevated temperatures is attributed to enhanced hydrogen desorption and de-trapping from hydrogen traps. These findings offer valuable insights for developing HE-resistant SX superalloys, which could ultimately strength the performance of hydrogen-powered aircraft engines. More recent studies have tackled particular applications and have brought significant advance in the field Hydrogen-resistance of different materials in fasteners [14]. Also, experimental findings in an interesting study on hydrogen effect on additively manufactured (AM) materials [15] has shown that it can be less severe in AM-made than in conventionally manufactured metals, with the specific microstructure playing a crucial role in the susceptibility to HE and hydrogen-induced crack initiation (HICI). Also, relevant to the present paper, Ronevich et al [16] showed that, while hydrogen-precharged corrosion-resistant alloys exhibit a loss of ductility at ambient temperatures, this loss is mitigated as the temperature is increased, with the materials’ behavior tending to revert to their non-hydrogen-charged state.
In contrast to the literature, the present study introduces a novelty in terms of exposure method and test method. Instead of using an electrolytic cell for exposure and charging, as well as the SSRT, the authors have chosen the following approach: exposure of materials to hydrogen gas and use of dynamic testing instead of static testing. The rationale for this choice is to create conditions closer to the relevant application, since in steelmaking it is gas and not an ionic solution that charges materials. Actually, Valentini et al [17], having developed a new continuous monitoring technique, showed that while electrochemical charging is a more severe method, gas charging is more suitable and accurate for real-world high-pressure gas applications. Finally, the reason for choosing fatigue as the test method is that the degradation of material fatigue performance has previously been strongly related to the HE in the literature [18,19].
It is true that novel industrial solutions for hydrogen embrittlement testing based on gas exposure are already available on the market [20], allowing testing with hydrogen gas according to ASTM E1681, F1624 and F519, providing simultaneously gas exposure and mechanical loading. However, they were not widely available on the market when this study was conceived in 2022, and testing facilities are currently heavily booked. Therefore, the authors have attempted to provide and describe in this paper an alternative laboratory solution for loading and testing.
It should be also highlighted that there are claims that, unlike CSR testing, fatigue measurements suffer from reversible deformation, and, in the case of metallic alloys, the results obtained depend on the atomic distribution in the solid solutions, namely the short-range atomic order [21,22]. As a result, plastic deformation is localized, causing dislocations to slip back and forth on the same slip planes during fatigue testing. However, this is relevant in simultaneous exposure and testing procedures, such as ones performed in the industrial equipment. In this case, the authors performed the hydrogen exposure first and then the fatigue test aiming at detecting permanent metallurgical changes such as the formation of brittle compounds or cracks which could deteriorate the material structural properties. Therefore, the proposed procedure remains valid for evaluation of the HE effect on our Nickel-based alloys.
2 Material and methods
2.1 Materials
The materials addressed in this study were the two high-temperature nickel-based alloys with the chemical composition ranges shown in Tables 1 and 2. For confidentiality reasons of ArcelorMittal, only the mass percentages of the main constituents are given and not the designation of the materials. Therefore, in further sections, they will be labelled as Material 1 and Material 2.
For the exposure to Hydrogen as well as for fatigue testing, samples of an adequate shape were needed. The Mini FP fatigue testing equipment, which will be explained in the next section ‘Methodology’, uses samples of 22 × 7 × 5 mm. Initial idea to use samples cut out of original components in the steelworks was discarded since the necessary procedure introduced uneven plastic deformation, which affected the dynamic performance of the samples. Hence, a flat material, manufactured using a process analogous to that employed in the production of the components in question, was purchased: Material 1: 100 × 100 × 5.25 mm, in foil obtained by rolling; Material 2: ø25.4 × 100, in rod obtained by rolling. In the case of the former, the short stripes have been cut as samples, while in the case of latter ø25.4 × 5 mm discs have been sliced first and then small stripes of 7 × 22 mm have been cut. After sampling, both materials were analyzed chemically and metallurgically and were in accordance with the materials used at ArcelorMittal. Figure 1 shows the comparison of Material 1 (Arcelor) and Material 2 (Goodfellow).
Chemical composition of the Material 1.
Chemical composition of the Material 2.
 |
Fig. 1 a) The microstructure overview of the as-received Material 1 of ArcelorMittal components, and b) the Material 2 plate from Good Fellow. Both characterized with grain size: 20–80 μm, γ-matrix. |
2.2 Methodology
The combined exposure and testing methodology consisted of the following four steps:
Exposure of the material to 100% hydrogen at room temperature
Exposure of the material to hydrogen at elevated temperature
Mechanical testing of exposed vs. non-exposed material − to compare the effect of embrittlement, if any, with the assessment of dynamic properties by fatigue testing.
Metallurgical observations − to identify the causes of embrittlement or failure, if any, in terms of what metallurgical transformation of the material is taking place to produce the embrittlement.
2.2.1 Exposure at room temperature
Figure 2 shows the laboratory setup used to perform the exposure.
The set-up consists of a small hydrogen reservoir (vol: 2L) directly connected to a 10L hydrogen tank with a one-way valve to ensure easy filling of the circuit, but to prevent loss of gas. Filling before each test is carried out until the pressure in the small reservoir is between 4.5 and 5 bar. The circuit ensures the flow of hydrogen by 1) a slight overpressure (150 mbar) in the sample holder and 2) a fan installed directly at the entrance to the sample holder. The total energy contained in the circuit during charging is equivalent to that of a cigarette lighter, which increases the safety of the test. The specimen holder accommodates 6 transversely positioned specimens (22 × 7 × 5 mm) which can be subjected to a laminar or turbulent regime depending on the fan setting. In our case it was set to turbulent to promote more hydrogen contact with the sample. The system has been tested to withstand more than 60 h of operation until the pressure reaches 1.5 bar. Below this pressure, the possibility of air entering the circuit is quite high, leading to a risk of deflagration. After 48 h of testing, the pressure in the circuit normally reaches 1.7–1.8 bar, sometimes remaining at 2.0 bar (depending on the ambient atmospheric pressure).
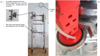 |
Fig. 2 a) Hydrogenisation (H2-O) setup and b) the sample holder. |
2.2.2 Exposure at the high temperature
The Inconel alloys are typically subjected to heat treatment including ageing at about 700 °C followed by slow cooling with intermediate holding at 600 °C. Along with precipitation of γ’/γ” phases, the short-range decomposition of the solid solution proceeds leading to localization of plastic deformation which is enhanced by hydrogen. However, in the case of this study, the exposure of the material samples was carried out at 1000 °C, because it is the estimated operating temperature of the components. The materials indeed reach 700 °C temperature while the component is brought to a working regime, but it happens in a very short period. On the contrary, they stay at 1000 °C much longer, which is why the behavior of the materials at this temperature is more relevant for industrial use.
This exposure was carried out at the facility of an industrial partner, by using the BORIS furnace. This pilot is a countercurrent reduction furnace, used in metallurgical research to study the properties of iron burden in a Blast Furnace or a Direct reduction shaft. For this study, the classic configuration of this equipment has been adapted to inject H2 (100%; 900 Nl/h) on samples heated at 1000 °C. All 34 samples were charged simultaneously between two beds of alumina beads in a single trial.
The 48 h cycle like in room temperature charging was replicated, although for safety reasons a continuous 48 h cycle was not possible. Charging was therefore achieved by four 10 h-exposure periods and one 8 h-exposure period during the day shift, when the furnace could be observed and controlled. The charging gas was pure 100% H2 at a temperature of 1000 °C. Between each exposure, the samples were flooded overnight with N2 inert gas to protect them from the influence of oxygen. All 34 samples were charged simultaneously.
2.2.3 Fatigue testing of charged and uncharged samples
Figure 3 shows the already mentioned Mini FP testing machine which was used to carry out the fatigue testing.
The Mini-FP concept developed at the University of Parma by prof. Gianni Nicoletto [23], is a breakthrough in this sense. This compact desktop device is usually used to evaluate the dynamic properties of small samples produced under different process or postprocessing conditions. It can be used for any comparative study: not only between different process parameters used to make a material, but also to compare different post-treatments of samples, chemical treatments, coatings, etc. − whenever the dynamic properties of the material are a revealing factor. Each sample is subdued to a determined load and the system registers the number of cycles at which the crack initiate. Alternatively, by absence of crack, the machine runs out at 10 million (M) cycles.
In this study, 60 test samples sized 22 × 7 × 5 mm, 30 per material, have been tested and have provided a total of 6 Wohler curves, one per each condition (uncharged, room-temperature charged, and high-temperature charged).
 |
Fig. 3 Mini FP fatigue testing equipment. |
2.2.4 Metallurgical analysis
To double-check and contrast the mechanical test results, a metallurgical analysis of metallographic cuts of samples and their fracture surface were examined. To this end, REM-TESCAN equipment based on scanning electron microscopy (SEM), and equipped with Energy Dispersive X-ray analysis (EDX) was used.
3 Results
3.1 Results of the fatigue tests
For charging at room temperature, the metal samples were mounted six at a time in the sample holder shown in Figure 2. Pure hydrogen was circulated through the apparatus at a turbulent flow rate of approximately 10 m/s and a pressure of >4 bar. The samples were mounted directly behind the ventilation system to create a turbulent flow regime like that found in the steelworks gas supply system. The following batches were performed:
Material 1 (18 samples):
Batch 1: Differential pressure: 390 Pa, Temperature: 6–12 °C; Pressure [start-end]: 4.1–2.3 bar.
Batch 2: Differential pressure: 34–390 Pa, Temperature: 12–16 °C; Pressure [start-end]: 4.2–2.8 bar.
Batch 3: Differential pressure: 310–410 Pa, Temperature: 7–16 °C; Pressure [start-end]: 4.2–1.8 bar.
Material 2 (18 samples):
Batch 1: Differential pressure: 310–350 Pa, Temperature: 6–11 °C; Pressure [start-end]: 4.4–1.8 bar.
Batch 2: Differential pressure: 340–395 Pa, Temperature: 7–10 °C; Pressure [start-end]: 4.7–1.7 bar.
Batch 3: Differential pressure: 310–370 Pa, Temperature: 7–9 °C; Pressure [start-end]: 4.2–1.6 bar.
At high temperature in the BORIS oven, 34 samples (17 of each material) were tested between two beds of alumina beads, with a gas flow of 900 Nl/h, temperature of 1000 °C, composition of gas 100% of H2 and, as already exposed before in sessions of 10 h (4 sessions) and 8 h (last session), with overnight regime in 100% N2.
Figures 4 and 5 show the resulting Wohler curves. For each curve a potential law was used for extrapolation, according to the indications of the equipment manufacturer [23]. In addition, the Mean Absolute Errors (MAE) for each curve has been calculated and a comparison of projected loads for the endurance of 5 million (M) cycles is offered. 5M cycles have been chosen since for many engineered components and structures 5M cycles are considered a threshold after which the product enters in high fatigue or long-life regime (e.g. ASTM E466/466M, ASTM E739, etc.).
For better understanding of the below-presented results, it is important to acknowledge that the major concentration of points at the left side obeys the predetermined regime of loads under which the test procedure is designed. Namely, this procedure requires the setup of different dynamic load values, seeking the test procedure then the number of cycles at which the sample breaks under each specific load. Since the potential curve, used to represent the Wohler curve, is steeper on the left and less steep on the right, there is higher concentration of break points at higher loads (left side). In any case, the creators of the technique have vastly proven the validity of this concept [23–26]. The same literature work has shown relative values of MAE, meaning MAE divided by the maximal applied load, to range an average value of 3–5%. Hence, the relative MAE values for all 6 curves lay in the range of expected.
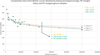 |
Fig. 4 Comparative view of the extrapolated potential curves representing Wohler curves of uncharged (orange), RT charged (blue) and HT charged (green) samples of the Material 1. MAE ranges from 2.2 to 5.5% of the maximum nominal load. Numerical values of extrapolated load correspond to 5M cycles. |
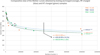 |
Fig. 5 Comparative view of the extrapolated potential curves representing Wohler curves of uncharged (orange), RT charged (blue) and HT charged (green) samples of the Material 2. MAE ranges from 1.7 to 4.4% of the maximum nominal load. Numerical values of extrapolated load correspond to 5M cycles. |
3.2 Microstructural analysis of the samples cuts
Several sections of RT charged specimens were first examined under the SEM after use in fatigue testing. Figures 6 and 7 show a comparison of the section of uncharged and RT charged and HT-charged, respectively. The underlying microstructure shows no significant change after charging compared to the original microstructure in Material 1. The backscattered electron images show an equiaxed microstructure and the specimen has a relatively uncomplicated microstructural phase, namely the γ phase with Cr-rich carbides and the absence of the γ’ forming elements. As the literature claims that the smaller grain sizes are more susceptible to cracking [25], the grain size was investigated. The grain size was above 50 μm. The grains are well visible, and the grain boundaries can be seen at 20 μm magnification. The carbides do not play a significant role as there are not many of them dispersed in the material. The absence of intragranular carbides may therefore explain why the material is not affected by hydrogen infiltration.
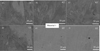 |
Fig. 6 SEM images of different areas in a), d) uncharged (UC), b), c) room temperatures (RT) and e), f) high temperatures (HT) charged samples of Material 1, showing absence of the hydrogen induced cracks and microstructural changes in the charged samples. |
 |
Fig. 7 SEM images of different areas in a), d) uncharged (UC), b), c) room temperatures (RT) and e), f) high temperatures (HT) charged samples of Material 2, showing absence of the hydrogen induced cracks and microstructural changes in the charged samples. |
 |
Fig. 8 Fracture surfaces of outer area of sample of Material 1 a) uncharged (UC) vs. b) charged at room temperature (RT). |
3.3 Fracture analysis of the samples
The Mini FP2 Fatigue Tester does not usually bring the specimen to full failure. Instead, it stops after detecting crack initiation in the specimen. However, with an aim to observe the fracture, the process was deliberately continued to fracture in certain specimens. The aim was to evaluate the brittleness of the fracture in case it could indicate the HE effects.
Figure 8 shows the comparison of fracture aspects of uncharged and RT-charged sample made in Material 1 and tested at the nominal load of 450 MPa, while Figure 9 shows the comparison of fracture aspects at the same load, but between uncharged and HT-charged sample. The first comparison shows the outer areas of the sample.
The uncharged specimen shows ductile fracture behavior without any transgranular facets in the outer region. In the inner region of the material, the specimen is fractured by ductile microvoid coalescence, as indicated by the dimples in this region. The RT charged sample shows very similar behavior. It also shows dimples within the inner region, while the outer region of the charged sample shows ductile behavior also. In neither of them transgranular facets or micro-facet cleavage are found, which would indicate embrittlement of the material. The absence of slip lines and crack ridges, which have been suggested to be formed by hydrogen ingress [27], are not found in this microstructure.
In similar manner, the outer region of the HT specimen shows intergranular fractures, whereas the inner region of the material shows a more ductile fracture behavior as it shows more dimple-like behavior. Although intergranular fractures can be found in the upper region of the material where crack nucleation is initiated, this does not change between the uncharged, RT-charged and HT-charged specimens.
The analysis has been repeated for Material 2. The following Figures show the comparison of uncharged versus RT-charged sample and versus HT-charged samples, respectively. However, in this case a higher nominal load has been chosen (750 MPa). The observations are quite aligned with Material 1, finding dimples in the inner and more ductile break in the outer regions of the sample, the observations being identical in all three types of samples (Figs. 10 and 11).
 |
Fig. 9 Fracture surfaces of outer area of sample of Material 1 a) uncharged (UC) vs. b) charged at high temperature (HT). |
 |
Fig. 10 Fracture surfaces of inner area of sample broken at 750 MPa of Material 2 a) uncharged (UC) vs. b) charged at room temperature (RT). |
 |
Fig. 11 Fracture surfaces of inner area of sample broken at 750 MPa of Material 2 a) uncharged (UC) vs. b) charged at high temperature (HT). |
4 Discussion
In this research study, the authors have presented the results of extensive testing of two nickel-based alloys commonly used in the manufacture of components in the steelworks supply system. The employed testing strategy was designed to replicate laboratory conditions similar to those expected in a future green hydrogen powered steel plant. The choice of exposure methods and conditions, as well as the test procedure, reflects the desire of industrial partners to study the change in structural behavior of Material 1 and 2 when exposed to hydrogen gas in the service system. Therefore, the dynamic behavior of the material at room temperature and at 1000 °C were chosen as the key parameters.
After exposure, the material specimens were mechanically tested using the dynamic resistance of the material as an indicator of hypothetical hydrogen embrittlement (HE). Wohler curves were therefore obtained for all materials and conditions (6 in total) by extrapolation, using the potential curve obtained from a minimum of 10 points in each case. For each curve, the Mean Absolute Error (MAE), on one side, and the predicted load value for 5,000,000 cycles, on the other side, were calculated and compared. The relative value of the MAE (taken as the average MAE against the highest load applied in the test procedure for each curve) is within the range of 2.2%–5.5% and 1.7%–4.4% for Materials 1 and 2 respectively, which is in accordance with the range for this type of test procedure found in the literature. The test results can therefore be labelled as consistent.
When compared, the predicted loads that would cause failure at 5,000,000 cycles show very similar values for material 1 in all conditions. The differences between RT and uncharged (+3.8%) and HT and uncharged (−1.8%) curve values remain below/inside the MAE range, which allows us to conclude that there is no relevant influence of HE on the structural strength of Material 1.
In the case of Material 2, the relationship between the uncharged and HT charged curves shows a similar value (+1.2%), but the comparison of the predicted load value at 5,000,000 cycles of the RT charged and uncharged curves shows a difference of +9.1%, which is substantially higher than the MAE range. This could indicate that the RT-charged material has indeed increased structural strength. However, the microstructure of the specimens, as well as their fracture surface, as observed under the SEM, do not show clear evidence of any metallurgical change in the RT-charged specimens of Material 2 that could support this increase in structural strength. Furthermore, no significant difference is observed in any of the loaded specimens, both in Material 1 and 2. Therefore, despite the increased dynamic strength in the case of the RT-charged curve of Material 2, no evidence of the influence of HE on the structural behavior of Material 1 and 2 could be observed.
In any case, the authors would like to highlight that this study was limited to laboratory conditions and the cycle duration of 48 h. This does not entirely replicate the Hydrogen load and use cycles in the future green steelworks which are longer. As a future work, it is intended to expose the specimens for longer periods in the prototype green steel plant. Only then can it be definitively confirmed that HE does not affect these two materials.
Acknowledgments
Ulrike Kleb and Sonja Petrovic are acknowledged for their support and valuable inputs to statistical evaluation of the Wohler curves.
Funding
This research was funded by the European Health and Digital Executive Agency (HADEA), grant number 101058692–project “Recycling renewable hydrogen for climate neutrality − RecHycle”.
Conflicts of interest
The institutions of all authors received funding from the European Health and Digital Executive Agency (HADEA). V. Petrovic certifies that he has no financial conflicts of interest (e.g., consultancies, stock ownership, equity interest, patent/licensing arrangements, etc.) in connection with this article, since the entire share of his work on this manuscript, except the writing, has been done while he was employed at the JOANNEUM RESEARCH Forschungs GmbH.
Data availability statement
Data associated with this article cannot be disclosed due to legal and confidentiality reasons of ArcelorMittal.
Author contribution statement
Conceptualization, K.S., V.P.; Methodology, K.S., V.P., Y.G.; Software, K.S., V.P.; Validation, R.K.; Formal Analysis, R.K.; Investigation, K.S., V.P.; Resources, V.P.; Data Curation, V.P.; Writing − Original Draft Preparation, V.P.; Writing − Review & Editing, R.K., V.P.; Visualization, K.S., V.P.; Supervision, V.P.; Project Administration, V.P., R.K.; Funding Acquisition, V.P.
References
- F. Giuliani, N. Paulitsch, A. Hofer et al., Combining machine learning, embedded sensor networks and additive burner design for combustor structural health monitoring, in: Proceedings of the ASME Turbo Expo 2024, Turbomachinery Technical Conference and Exposition, London, United Kingdom, June 24-28, 2024, pp. GT2024–127925 [Google Scholar]
- M. Kyriakopoulos, European Commission, European Aviation Research in Horizon Europe, Vienna Aviation Days, Vienna, Austria, 8-9th July 2024, pp. 11 [Google Scholar]
- Research study: Novel postprocessing for fatigue and hydrogen resistance of Additive Manufacturing aircraft materials, LaSPAM Project, https://projekte.ffg.at/projekt/4121912, lastaccessed 2025/05/24 [Google Scholar]
- S. Huang, E. Agyenim-Boateng, J. Sheng et al., Effects of laser peening with different laser power densities on the mechanical properties of hydrogenated TC4 titanium alloy, Int. J. Hydrogen Energ. 44, 17114 (2019) [Google Scholar]
- H.K. Birnbaum, P. Sofronis, Hydrogen-enhanced localized plasticity—a mechanism for hydrogen-related fracture, Mat. Sci. Eng. A-Struct. 176, 191 (1994) [Google Scholar]
- W.W. Gerberich, R.A. Oriani, M.-J. Lji et al., The necessity of both plasticity and brittleness in the fracture thresholds of iron, Philos. Mag. A 63, 363 (1991) [Google Scholar]
- S. Lynch, Mechanistic and fractographic aspects of stress corrosion cracking, Corros. Rev. 30, 63 (2012) [Google Scholar]
- S.K. Dwivedi, M. Vishwakarma, Hydrogen embrittlement in different materials: a review, Int. J. Hydrogen Energy, 43, 21603–21616 (2018) [Google Scholar]
- F. Lecoester, J. Chêne, D. Noel, Hydrogen embrittlement of the Ni-base Alloy 600 correlated with hydrogen transport by dislocations, Mat. Sci. Eng. A-Struct 262, 173 (1999) [Google Scholar]
- J. Hou, Q.J. Peng, K. Sakaguchi et al., Effect of hydrogen in Inconel Alloy 600 on corrosion in high temperature oxygenated water, Corr. Sci. 52, 1098 (2010) [Google Scholar]
- P. Cavaliere, Hydrogen embrittlement: the case of nickel alloys, hydrogen embrittlement in metals and alloys, Springer Nature, Switzerland, Cham, 2025, pp. 625–679 [Google Scholar]
- X. Lu, Y. Ma, D. Wang, On the hydrogen embrittlement behavior of nickel-based alloys: alloys 718 and 725, Mat. Sci. Eng. A-Struct. 792, 139785 (2020) [Google Scholar]
- K. Lokhande, M. Vishwakarma, A study of the effect of hydrogen on the fatigue behavior of metals, IOP Conf. Ser. Mat. Sci. Eng. 1248, 012026 (2022) [Google Scholar]
- S. Corsinovi, L. Bacchi, M. Mastroianni et al., Hydrogen embrittlement in high strength fasteners: comparison between bainitic and tempered martensitic steels, Eng. Fail. Anal. 152, 107474 (2023) [Google Scholar]
- A. Behvar, M. Haghshenas, M.B. Djukic, Hydrogen embrittlement and hydrogen-induced crack initiation in additively manufactured metals: a critical review on mechanical and cyclic loading, Int. J. Hydrogen Energy, 58, 1214–1239 (2024) [Google Scholar]
- J. Ronevich, C. San Marchi, S. Narasimhachary et al., The mechanical behavior of corrosion resistant alloys at elevated temperature with internal hydrogen, in: Pressure Vessels and Piping Conference, American Society of Mechanical Engineers, Vol. 88506, 2024 July, p. V004T06A015 [Google Scholar]
- R. Valentini, L. Bacchi, F. Biagini, Application of laboratory and on field techniques to determine the risk of hydrogen embrittlement in gaseous hydrogen and relative mixtures transport and storage, Matériaux & Techniques, 111, 202 (2023) [CrossRef] [EDP Sciences] [Google Scholar]
- G. Lu, Y. Zhao, Z. Wen et al., Temperature dependence of hydrogen embrittlement susceptibility of nickel-based single crystal superalloy, J. Alloy. Compd. 1020, 179505 (2025) [Google Scholar]
- N.D. Adasooriya, Interaction of hydrogen damage and fatigue on structural integrity of hydrogen transport pipelines: a conceptual framework, in: Paper presented at the The 33rd International Ocean and Polar Engineering Conference, Ottawa, Canada, 2023, pp IISOPE-I-23-453 [Google Scholar]
- https://www.zwickroell.com/industries/energy, last accessed 2025/05/24 [Google Scholar]
- H. Margolin, Y. Mahajan, Y. Saleh, Grain boundaries, stress gradients and fatigue crack initiation, Scripta Metall. Mater. 10, 1115 (1976) [Google Scholar]
- J. E. Epperson, P. Fürnrohr, C. Ortiz, The short-range-order structure of α-phase Cu-Al alloys, Acta Crystallogr. A 34, 667 (1978) [Google Scholar]
- G. Nicoletto, Fatigue behavior of L-PBF metals: Cost-effective characterization via specimen miniaturization, J. Mat. Eng. Perf. 30, 5227 (2021) [Google Scholar]
- T. Varmus, R. Konecna, G. Nicoletto et al., Microstructure and fatigue properties of Al2024-RAM2 aluminum alloy obtained by laser powder bed fusion, Proc. Struc. Integr. 43, 184 (2023) [Google Scholar]
- F. Leonard, Study of stress corrosion cracking of alloy 600 in high temperature high pressure water, PhD Thesis, University of Manchester, 2010 [Google Scholar]
- G. Nicoletto, Directional and notch effects on the fatigue behavior of AS-built DMLS TI6AL4V, Int. J. Fatigue 106, 124 (2018) [Google Scholar]
- X. Li, X. Ma, J. Zhang et al., Review of hydrogen embrittlement in metals: hydrogen diffusion, hydrogen characterization, hydrogen embrittlement mechanism and prevention, Acta Metall. Sin. −Engl. 33, 759 (2020) [Google Scholar]
Cite this article as: Katharina Shickle, Reinhard Kaindl, Yann Graz, Vojislav Petrovic, Study of hydrogen embrittlement in the green steelworks − the case of the high temperature nickel-based alloys, Matériaux & Techniques 113, 401 (2025), https://doi.org/10.1051/mattech/2025012
All Tables
All Figures
|
Fig. 1 a) The microstructure overview of the as-received Material 1 of ArcelorMittal components, and b) the Material 2 plate from Good Fellow. Both characterized with grain size: 20–80 μm, γ-matrix. |
| In the text | |
|
Fig. 2 a) Hydrogenisation (H2-O) setup and b) the sample holder. |
| In the text | |
|
Fig. 3 Mini FP fatigue testing equipment. |
| In the text | |
|
Fig. 4 Comparative view of the extrapolated potential curves representing Wohler curves of uncharged (orange), RT charged (blue) and HT charged (green) samples of the Material 1. MAE ranges from 2.2 to 5.5% of the maximum nominal load. Numerical values of extrapolated load correspond to 5M cycles. |
| In the text | |
|
Fig. 5 Comparative view of the extrapolated potential curves representing Wohler curves of uncharged (orange), RT charged (blue) and HT charged (green) samples of the Material 2. MAE ranges from 1.7 to 4.4% of the maximum nominal load. Numerical values of extrapolated load correspond to 5M cycles. |
| In the text | |
|
Fig. 6 SEM images of different areas in a), d) uncharged (UC), b), c) room temperatures (RT) and e), f) high temperatures (HT) charged samples of Material 1, showing absence of the hydrogen induced cracks and microstructural changes in the charged samples. |
| In the text | |
|
Fig. 7 SEM images of different areas in a), d) uncharged (UC), b), c) room temperatures (RT) and e), f) high temperatures (HT) charged samples of Material 2, showing absence of the hydrogen induced cracks and microstructural changes in the charged samples. |
| In the text | |
|
Fig. 8 Fracture surfaces of outer area of sample of Material 1 a) uncharged (UC) vs. b) charged at room temperature (RT). |
| In the text | |
|
Fig. 9 Fracture surfaces of outer area of sample of Material 1 a) uncharged (UC) vs. b) charged at high temperature (HT). |
| In the text | |
|
Fig. 10 Fracture surfaces of inner area of sample broken at 750 MPa of Material 2 a) uncharged (UC) vs. b) charged at room temperature (RT). |
| In the text | |
|
Fig. 11 Fracture surfaces of inner area of sample broken at 750 MPa of Material 2 a) uncharged (UC) vs. b) charged at high temperature (HT). |
| In the text | |
Current usage metrics show cumulative count of Article Views (full-text article views including HTML views, PDF and ePub downloads, according to the available data) and Abstracts Views on Vision4Press platform.
Data correspond to usage on the plateform after 2015. The current usage metrics is available 48-96 hours after online publication and is updated daily on week days.
Initial download of the metrics may take a while.