")
")
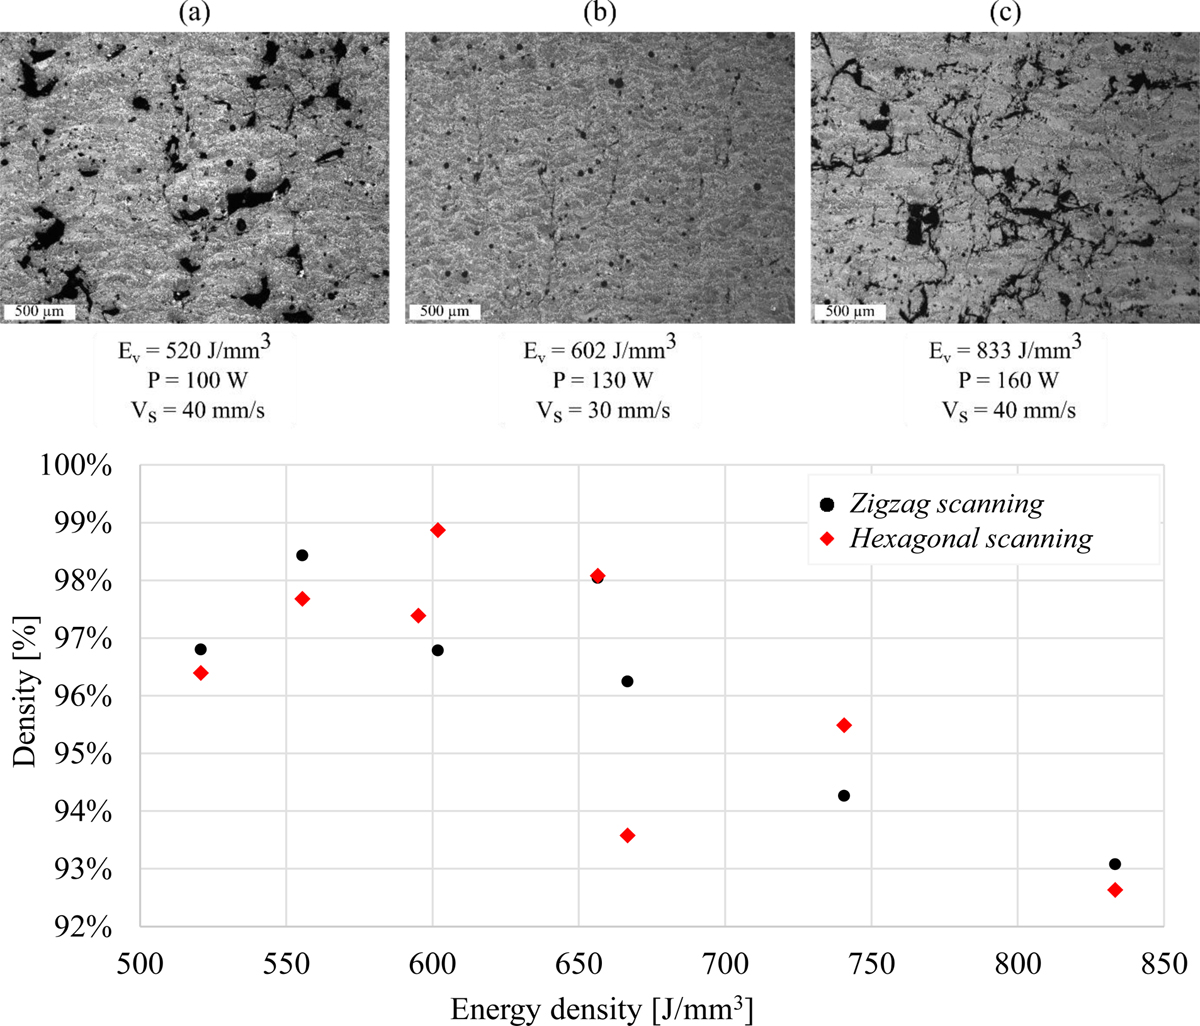
Fig. 6
Download original image
Top: SEM images of samples manufactured via the hexagonal scanning strategy at (a) low, (b) medium, and (c) high energy densities. Bottom: Plot of sample density vs. energy density for zigzag and hexagonal scanning strategies.
En haut : images microscopes d’échantillons fabriqués selon la stratégie de balayage hexagonale à (a) faible, (b) moyenne et (c) haute densité d’énergie. En bas : évolution de la densité de l’échantillon en fonction de la densité d’énergie volumique pour les stratégies de balayage en aller/retour et hexagonale.
Current usage metrics show cumulative count of Article Views (full-text article views including HTML views, PDF and ePub downloads, according to the available data) and Abstracts Views on Vision4Press platform.
Data correspond to usage on the plateform after 2015. The current usage metrics is available 48-96 hours after online publication and is updated daily on week days.
Initial download of the metrics may take a while.