")
")
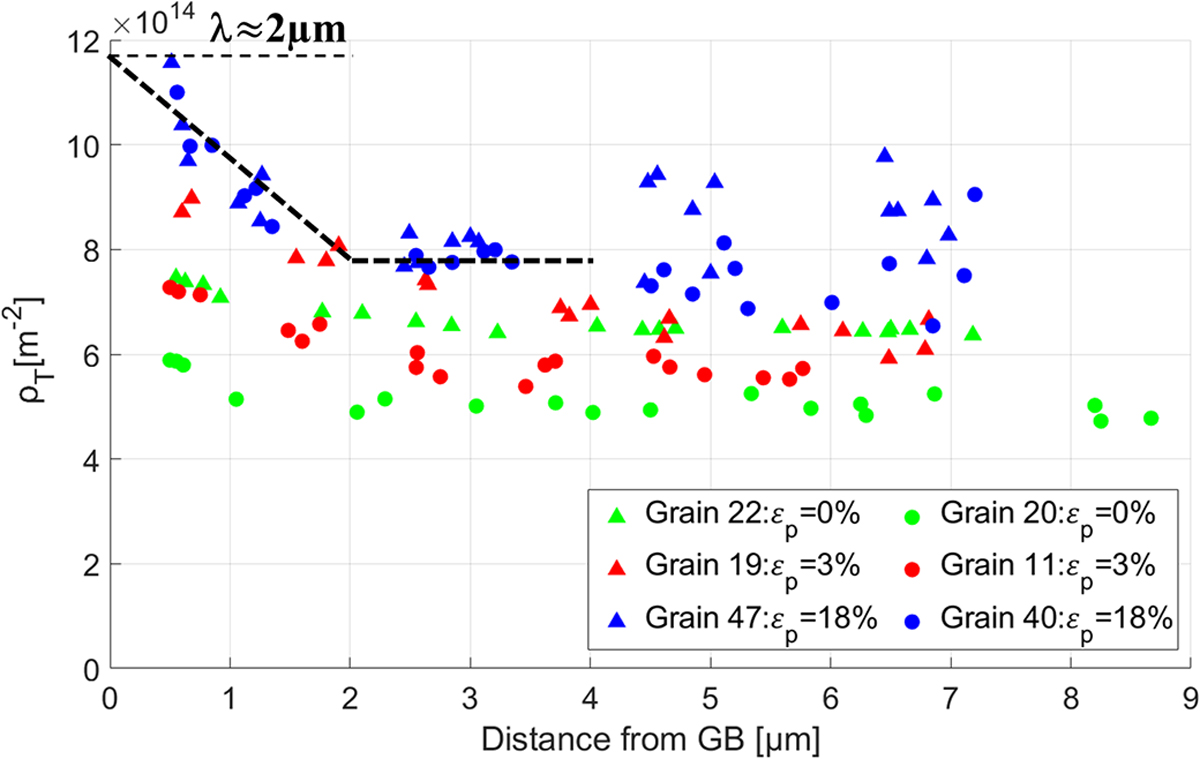
Fig. 7
Download original image
Total dislocation density ρT estimated from H as a function of the distance from GB for the undeformed sample in grains 22 and 20; the deformed samples at εp = 3% in grains 11 and 19, and, at εp = 18% in grains 47 and 40. The black dotted lines are a guide for the eye to estimate the thickness λ of the grain boundary affected layer.
Current usage metrics show cumulative count of Article Views (full-text article views including HTML views, PDF and ePub downloads, according to the available data) and Abstracts Views on Vision4Press platform.
Data correspond to usage on the plateform after 2015. The current usage metrics is available 48-96 hours after online publication and is updated daily on week days.
Initial download of the metrics may take a while.