")
")
Fig. 3
Download original image
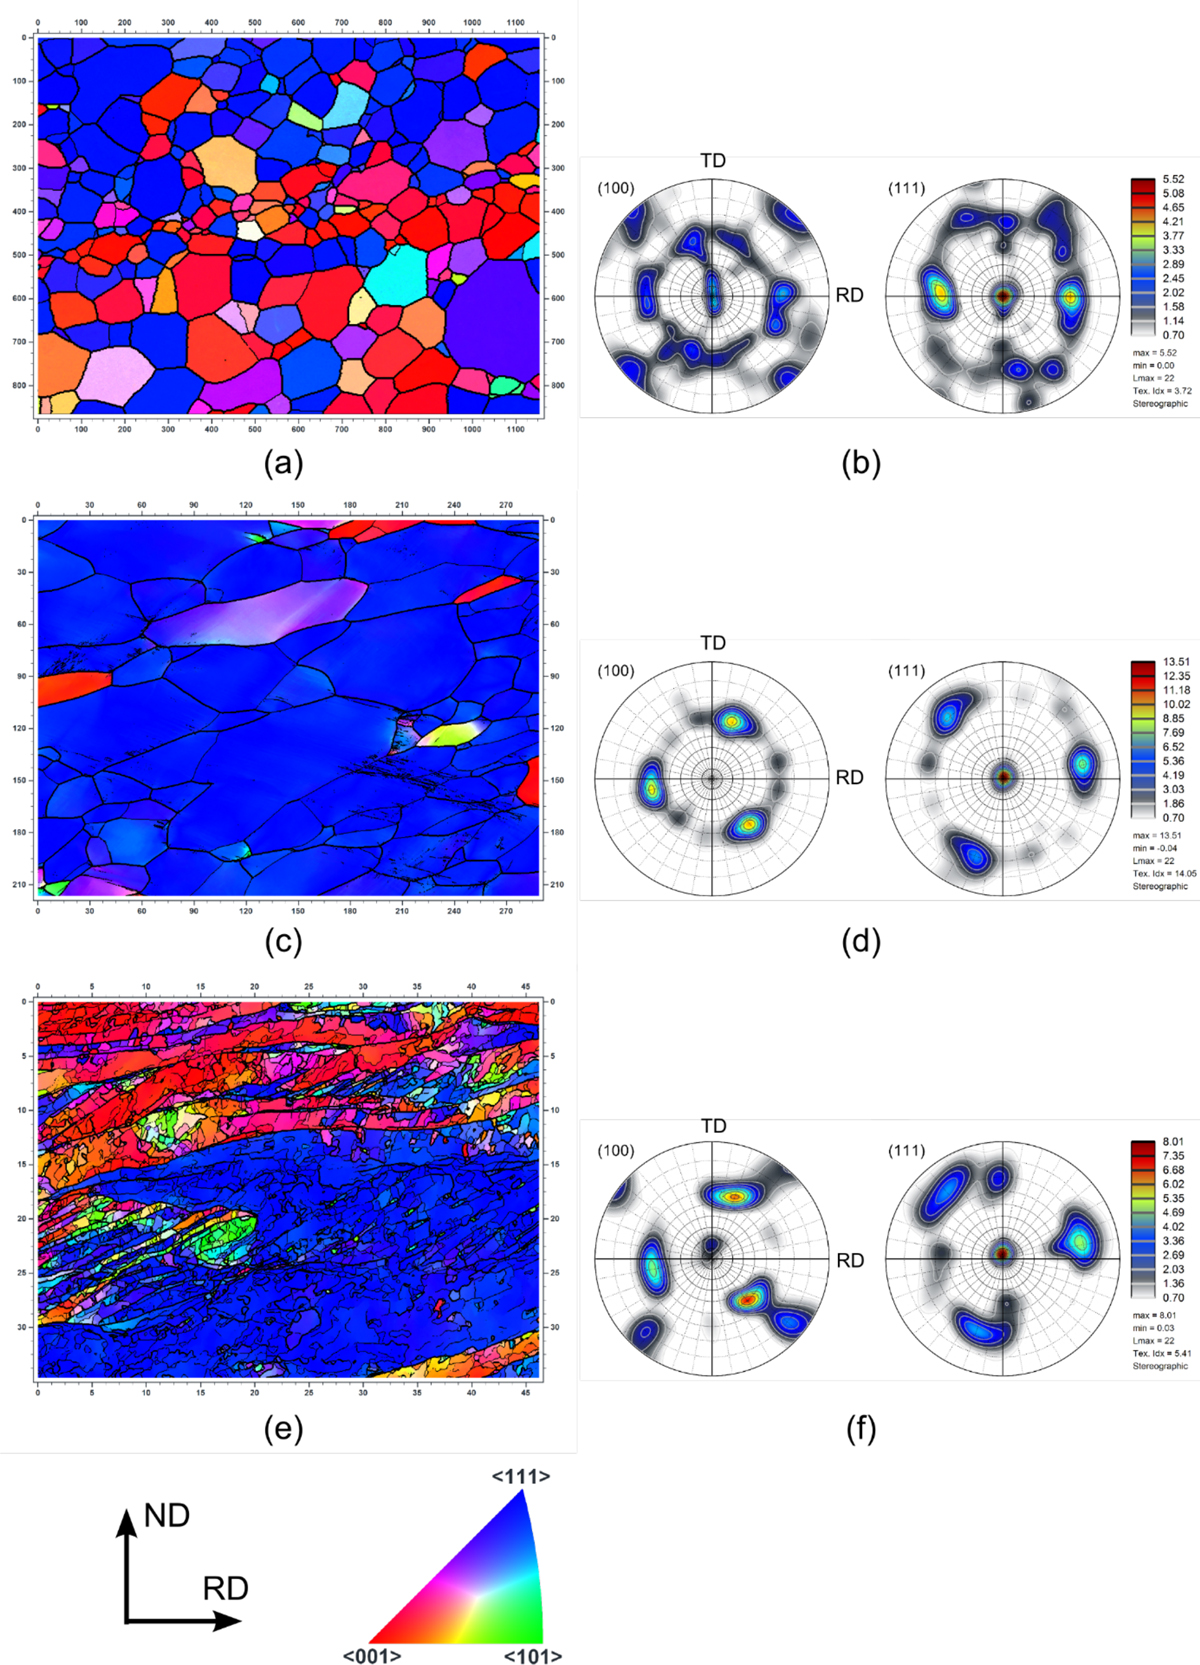
EBSD maps (orientation color code defined according to the ND projected into the standard triangle) and related pole figures (density color coded; blue for low to red for the highest densities). Thick black lines are boundaries with a disorientation higher than 10°, thin ones have a disorientation in the range 2–10°. a,b: Reference fully recrystallized; c,d: 25% cold-rolled- and; e,f: 92% cold-rolled-samples.
Cartes EBSD (code de couleur défini selon la projection de la direction normale ND dans le triangle standard) et figures de pôle correspondantes (le code de couleur indique une densité croissante du bleu vers le rouge). Les traits gras représentent les joints de grains de désorientation supérieure à 10°, les traits minces une désorientation comprise entre 2 et 10°. a,b : État recristallisé ; c,d : État faiblement laminé (réduction de 25 %) ; e, f : État fortement laminé (réduction de 92 %).
Current usage metrics show cumulative count of Article Views (full-text article views including HTML views, PDF and ePub downloads, according to the available data) and Abstracts Views on Vision4Press platform.
Data correspond to usage on the plateform after 2015. The current usage metrics is available 48-96 hours after online publication and is updated daily on week days.
Initial download of the metrics may take a while.