")
")
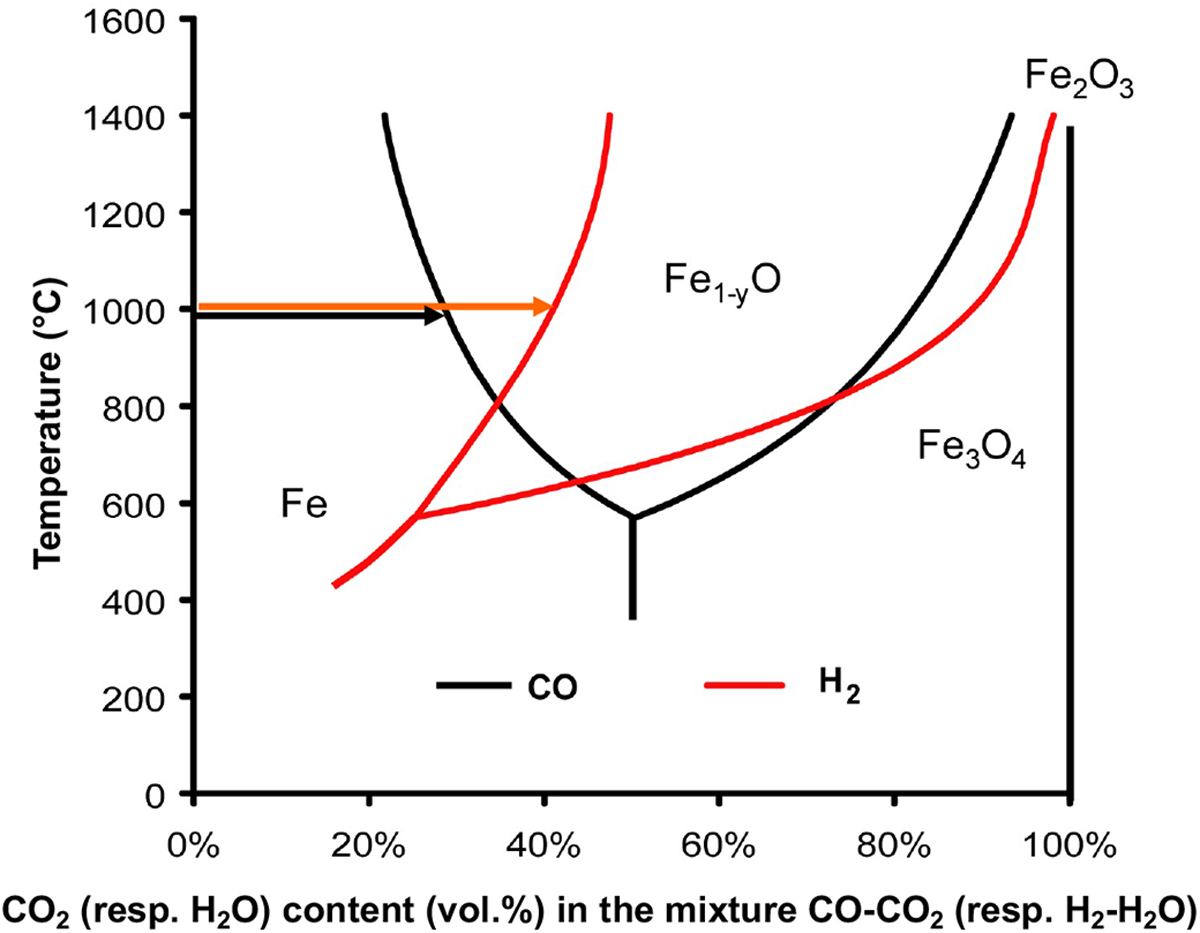
Fig. 2
Download original image
Phase diagram of the iron phase domains as a function of the oxidizing power of the gas and temperature, for the gas mixtures CO–CO2 and H2–H2O. The arrows represent the driving force for the wüstite-to-iron reduction.
Current usage metrics show cumulative count of Article Views (full-text article views including HTML views, PDF and ePub downloads, according to the available data) and Abstracts Views on Vision4Press platform.
Data correspond to usage on the plateform after 2015. The current usage metrics is available 48-96 hours after online publication and is updated daily on week days.
Initial download of the metrics may take a while.