")
")
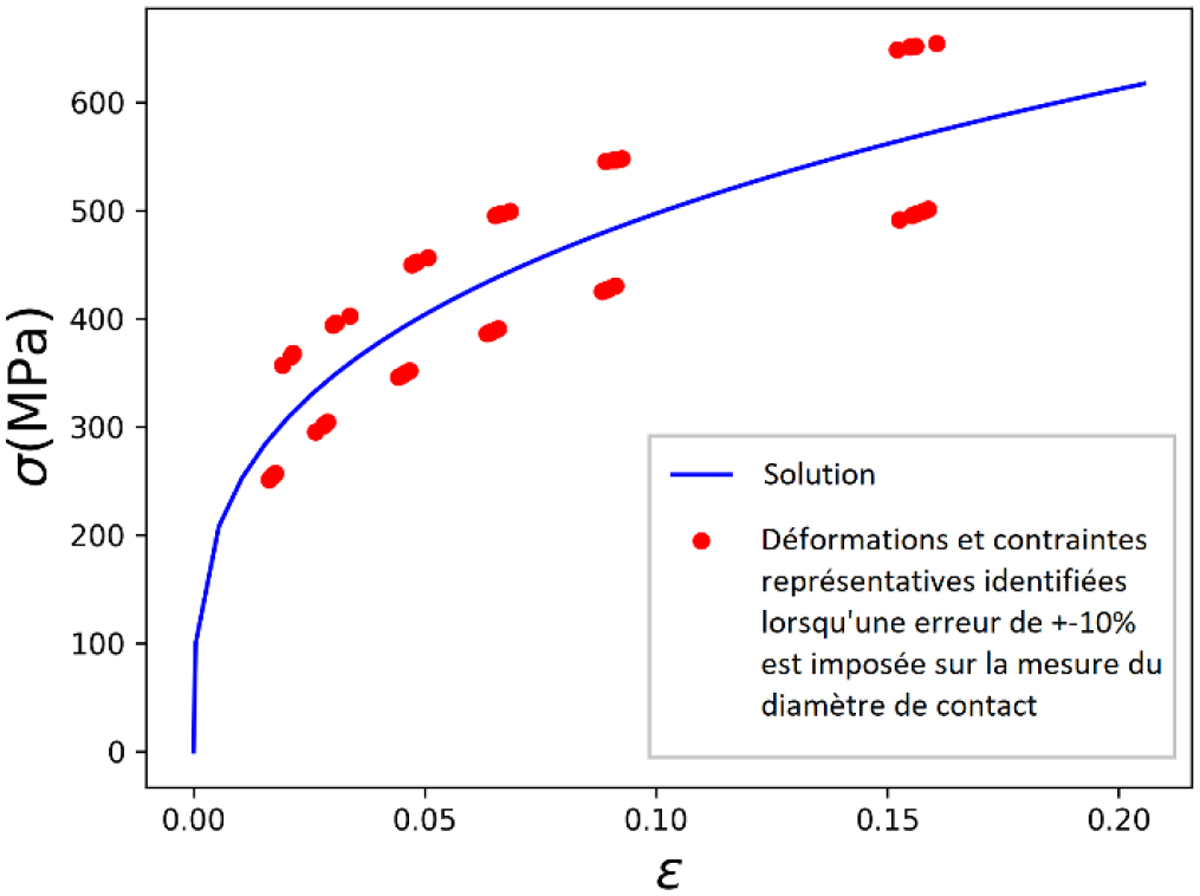
Fig. 10
Download original image
Comparaison entre la courbe contrainte–déformation correspondant à la solution (E = 210 GPa, σy = 100 MPa, n = 0,3) et les déformations et contraintes représentatives identifiées lorsqu’une erreur de ± 10 % sur la mesure du diamètre de contact est imposée.
Comparison between the stress-strain curve corresponding to the solution (E = 210 GPa, σy = 100 MPa, n = 0.3) and the representative strains and stresses identified when an error of ± 10% on the contact diameter measurement is imposed.
Current usage metrics show cumulative count of Article Views (full-text article views including HTML views, PDF and ePub downloads, according to the available data) and Abstracts Views on Vision4Press platform.
Data correspond to usage on the plateform after 2015. The current usage metrics is available 48-96 hours after online publication and is updated daily on week days.
Initial download of the metrics may take a while.