")
")
Fig. 1
Download original image
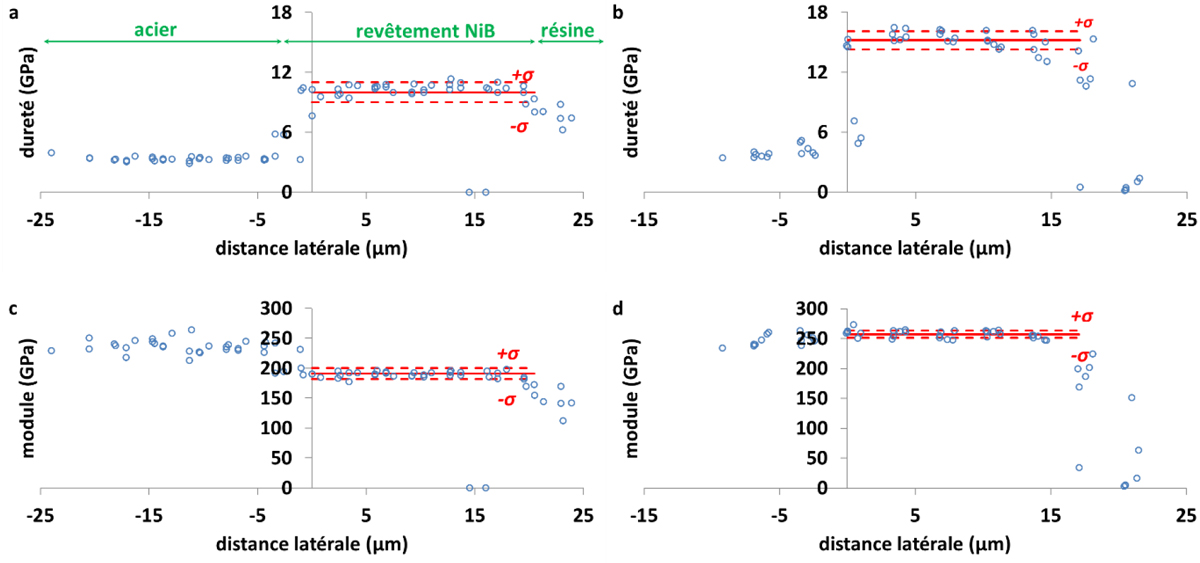
Dureté (a) et module (c) de l’échantillon brut, dureté (b) et module (d) de l’échantillon traité thermiquement. La moyenne des valeurs est représentée (trait rouge continu), ainsi que l’écart-type (trait rouge pointillé).
Hardness (a) and modulus (c) of the pristine sample, hardness (b) and modulus (d) of the heat treated sample. The average value is drawn (continuous red line), as well as the standard deviation (dashed red line).
Current usage metrics show cumulative count of Article Views (full-text article views including HTML views, PDF and ePub downloads, according to the available data) and Abstracts Views on Vision4Press platform.
Data correspond to usage on the plateform after 2015. The current usage metrics is available 48-96 hours after online publication and is updated daily on week days.
Initial download of the metrics may take a while.