")
")
| Issue |
Matériaux & Techniques
Volume 106, Number 3, 2018
Assemblages Mécaniques / Mechanical Assemblies
|
|
|---|---|---|
| Article Number | 309 | |
| Number of page(s) | 12 | |
| Section | Assemblage / Joining and assembly | |
| DOI | https://doi.org/10.1051/mattech/2018036 | |
| Published online | 06 November 2018 | |
Regular Article
Experimental and numerical investigation of the overload effect on fatigue behaviour of spot-welded steel sheets
Étude expérimentale et numérique de l’influence de surcharges sur le comportement en fatigue de tôles en acier assemblées par points soudés
1
Université Clermont Auvergne, CNRS, Institut Pascal,
63000
Clermont-Ferrand, France
2
Institut Universitaire Polytechnique de Mongo,
Mongo, Chad
3
Technocentre Renault,
1 avenue du Golf,
78084
Guyancourt, France
4
Arcelormittal Maizières Research SA,
BP 30320 Voie Romaine,
57283
Maizières-Les-Metz cedex, France
* e-mail: This email address is being protected from spambots. You need JavaScript enabled to view it.
Received:
11
October
2017
Accepted:
2
July
2018
Abstract
Spot-weld joints are commonly used to fasten together metal sheets in automotive industry. The car frame used in Renault vehicles is a representative example of the usefulness of this method. Most of the spot-welds experience fatigue damaging occurrence due to rough roads or driving conditions which apply periodical overloads to the vehicle. Understanding their fatigue behaviour is crucial from the viewpoint of failure prevention in design. In this study, a series of experiments was conducted to study the fatigue failure of spot-welded tensile-shear specimens made of a deep-drawing steel (XES) and High strength low alloy steels (HE360D and XE360D). Two different types of fatigue tests were performed, the first one with a constant-amplitude sinusoidal loading (loading ratio equal to 0.1) and the second one with one incidental overload cycle introduced per 100 cycles. The experimental results show a favourable effect of overloads for HSLA steel specimens, whereas the effect is the opposite for XES steel specimens. A finite element analysis was carried out using the open-source Salome-Meca platform to determine the stress states within the specimens around the weld spot and explains both failure modes observed on the specimens at high and low loads.
Résumé
L’assemblage de tôles d’acier au moyen du procédé de soudage par point est couramment utilisé dans l’industrie automobile – notamment chez Renault – pour la réalisation du châssis. Les efforts rencontrés en service liés à des routes accidentées ou aux conditions de conduite sont transmis entre composants assemblés via les points soudés. Comprendre leur comportement à la fatigue sous surcharges incidentelles est donc essentiel pour s’assurer de leur tenue en service et dimensionner de façon permanente la structure. Dans cette présente étude, une campagne d’essais expérimentale a été conduite de manière à analyser les modes de défaillance par fatigue de deux tôles d’acier identiques assemblées par points soudés et sollicitées en traction-cisaillement. Deux nuances d’acier à haute limite d’élasticité (HE360D et XE360D) et une nuance d’acier doux pour emboutissage (XES) ont été testées soit à amplitude constante, soit avec des sollicitations incidentelles survenant à raison d’un cycle de surcharge pour 100 cycles appliqués. L’ensemble des cycles présente le rapport de charge de 0,1 (traction ondulée). Les résultats expérimentaux ont montré que les surcharges périodiques sont bénéfiques à la tenue en fatigue dans le cas des aciers à haute limite d’élasticité alors que l’effet enregistré est au contraire un affaissement très marqué des propriétés de fatigue pour l’acier doux. Des calculs par éléments finis sous la plateforme libre Salome-Meca ont permis de déterminer les états de contraintes multiaxiaux dans les zones expérimentales d’amorçage et de fissuration des éprouvettes autour du point soudé et de mettre en évidence les deux modes de défaillance observés sur les éprouvettes à haut et à faible niveaux d’effort appliqué.
Key words: weld spot / heat affected zones / overload / failure modes / fatigue tests / multiaxial fatigue criterion
Mots clés : point soudé / surcharge / mode de défaillance / acier à haute limite d’élasticité / acier doux
© F. Pennec et al., published by EDP Sciences, 2018
 This is an Open Access article distributed under the terms of the Creative Commons Attribution License (http://creativecommons.org/licenses/by/4.0), which permits unrestricted use, distribution, and reproduction in any medium, provided the original work is properly cited.
1 Introduction
The car frame is a complex structure made by the complete connection of a high number of components. These automotive parts are manufactured by cutting and stamping steel sheets. The conventional resistance spot welding is the dominant process for joining sheet metals particularly in automotive industry. One classical vehicle contains more than 3000 spot welds [1,2]. The advantages of using spot welds are high operating speeds of the joining process and its suitability for automation.
Large temperature gradients are created by the intense local heating during the welding process followed by rapid cooling. They induce three main distinct microstructural zones in the weld and its surrounding area (Fig. 1). The fusion zone (FZ) or weld nugget has a hardness profile value between 2 and 2.5 times stronger than that of the parent metal [3]. The heat affected zone (HAZ) undergoes microstructural changes during welding causing its brittleness. The last zone is the steel base metal (BM). Analysing and predicting the spot-welds fatigue failure is complex due to this heterogeneous microstructure and also its variable geometry in the connecting zone between both metal sheets.
Mechanical components as car frame usually experience cyclic loading in service. This makes fatigue failure prevention one of the foremost design requirements. Considering that spot welds provide localized connection, thus creating inherent circumferential notches, they lead to stress concentrations and consequently make the structure more likely to fail due to fatigue. For instance, approximately 80% of all cases of fatigue failure in automotive components occur around weld spots.
The purpose of this study is to experimentally investigate the weld fatigue properties of three steel grades subjected to sinusoidal tensile-shear loads with overload incidental cycles. The failure crack propagation paths have been observed and the failure mechanisms have been discussed by the aid of finite element analysis.
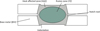 |
Fig. 1 Spot-weld cross-section. Coupe transversale d’un point soudé. |
2 Experimental procedure
The experimental program includes steel grades produced by ArcelorMittal and employed by Renault for manufacturing automotive components connected with weld spots. The three grades with an increasing strength are a non-alloyed mild steel (XES 1.2 mm) for deep drawing applications and two High strength low alloy steel (XE360D 1.2 mm and HE360D 2.5 mm). Their chemical composition and tensile mechanical properties are listed in Table 1.
The steel sheets were cut into 124 × 30 mm coupons along the transverse direction and subsequently resistance spot welded by Renault using welding machine setup corresponding to their industrial practice. This was done so as to produce one set of 50 identical welds for each steel grade. The geometry of the fatigue specimens is depicted in Figure 2.
The tensile-shear tests were performed using a MTS ± 100 KN servo-hydraulic testing machine. To obtain the material reference F-N curves the specimens were submitted to repeated tensile stress states (stress ratio equal to 0.1) with a 30-Hz frequency [4]. Single peak overload was applied every 100 cycles with a 20-Hz frequency in order to measure the effect of incidental overloads on the fatigue behaviour. Figure 3 shows the typical overloads and fatigue cycling sequence. The R overload ratios are equal to 1.4 or 2.3. They have been chosen according to loading and car response analyses induced by the driving conditions of the vehicle and used in durability calculations of automotive components under service loading. To prevent sheet bending around the weld spot and to reproduce the actual conditions of industrial components with bending stiffness provided by the transverse dimensions, the specimens are only tested in pure shear configuration in the contact plane of both sheets. The specimen is thus set up in a stiffener during the fatigue testing procedure.
Chemical composition and tensile properties of the steel grades (transverse direction).
Composition chimique et propriétés mécaniques des nuances d’acier (sens travers de laminage).
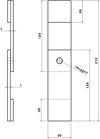 |
Fig. 2 Geometry of tested specimens. Géométrie des éprouvettes. |
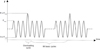 |
Fig. 3 Typical overloads and fatigue cycling used to obtain F-N curves with incidental overloads. Représentation des cycles de fatigue appliqués pour l’obtention des courbes F-N avec surcharges incidentelles. |
3 Failure modes
Two fatigue failure modes were observed on the tested specimens. Photographs of representative failed samples are shown in Figure 4. The first one is the interfacial mode, in which the fracture propagates through the weld nugget within its cross section. This failure mode occurs only at high loads. Pouranvari et al. [3] reported that it is predominantly observed with small nuggets. The optimum weld nugget size for automotive industry is 5t1/2, that is 7.9 mm for 2.5 mm thickness sheets and 5.5 mm for 1.2 mm thickness sheets, while the measured weld nugget diameter is between 6.1 and 6.6 mm for HE360D steel, between 3.7 and 4.2 mm for XES steel and between 4.5 and 5.5 mm for XE360D steel. The second observed failure mode at lower loads and higher number of cycles is the fracture propagation in one or both sheets of the specimen. The fatigue crack propagates around 25% of the nugget circumference and then propagates into the base steel sheet along a plane of maximum tension. The crack is aligned perpendicular to the applied tensile stress in the sheet. A slight deviation is noted for the deep-drawing steel specimens. For high loads or cycles with overload, the cracks initiates in BM and follows a circumferential path distant from the indentation surface within BM. Figure 5 shows schematic representations of crack growth path experienced in high strength steel specimens and XES steel specimens.
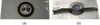 |
Fig. 4 Interfacial failure mode and sheet transverse failure mode. Faciès des sections rompues par fatigue (a) dans le cas d’une rupture par cisaillement du noyau, (b) pour le cas d’une fissuration de la tôle. |
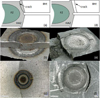 |
Fig. 5 Schematic representation of fatigue crack paths (a) in high strength steel and (d) in deep drawing steel subjected to overload cycles, (b) micrographs of HE360D specimen, (c) XE360D specimen, (e, f) XES specimens with 2.3 overload ratio. Représentation schématique de la propagation de fissure par fatigue (a) dans les aciers à haute limite d’élasticité, (d) dans les aciers doux pour emboutissage soumis à des cycles avec surcharges, (b) images 2D et 3D d’échantillons en acier HE360D, (c) XE360D, (e, f) XES avec rapport de surcharge égal à 2,3. |
4 Fatigue test results
Shear cracking of the weld spot under fatigue high loads leads to a number of cycles to failure lower than for the case of a sheet transverse fracture. The interfacial failure mode is in reality proscribed in the automotive industry. This failure mode is therefore the threshold criteria for the exploration of high loads in the F-N curve elaboration.
The overloading cycles influence is analysed in terms of service life. In the present study, the fatigue performance of spot welded tensile-shear specimens at constant amplitudes was the reference property for comparison to the fatigue lives of spot welded tensile-shear specimens under variable amplitude with periodical overloads.
4.1 HE360D steel case
Figure 6 shows the F-N curves of spot-welded HE360D at constant amplitudes and with periodical overloads of 1.4 and 2.3 ratio. Four fatigue model curves that pass through the set of experimental points are represented. These Wohler, Basquin, Stromeyer and Bastenaire smoothed curves are calculated through ESOPE code developed by ArcelorMittal.
The three F-N Basquin curves are presented on Figure 6(d) to compare the reference curve (with no overload) with the fatigue test results with 1.4 and 2.3 ratio overload cycles.
The overload is obviously advantageous to the fatigue resistance of HE360D weld spot. Incidental overload cycles enable 20% fatigue lifetime increase. Both overload ratios have approximately the same impact on the weld spot fatigue limit for service life between 5.105 and 2.106 cycles. For higher load, the 2.3 overload ratio has a larger positive impact on the fatigue life than the 1.4 overload ratio.
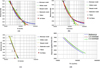 |
Fig. 6 Fatigue test results of HE360D specimens (a) without overload cycle (reference), (b) with 1.4 overload ratio, (c) with 2.3 overload ratio, (d) F-N smoothed Basquin curves. Résultats des essais de fatigue sur éprouvettes en acier HE360D (a) sans cycles de surcharge (référence), (b) avec cycles de surcharge de rapport 1,4, (c) avec cycles de surcharge de rapport 2,3, (d) courbes F-N lissées selon le modèle Basquin. |
4.2 XE360D steel case
As it is observed for HE360D specimens, both overload ratios lead to a significantly fatigue strength increase of XE360D weld spots (Fig. 7). The 2.3 overload ratio enables some 20% fatigue lifetime increase whereas the 1.4 overload ratio provides a considerably larger increase from 20% at 2.106 cycles to more than 100% at 5.105 cycles.
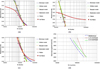 |
Fig. 7 Fatigue test results of XE360D specimens (a) without overload cycle (reference curve), (b) with 1.4 overload ratio, (c) with 2.3 overload ratio, (d) F-N Basquin curves. Résultats des essais de fatigue des éprouvettes en acier XE360D (a) sans cycles de surcharge (référence), (b) avec cycles de surcharge de rapport 1,4, (c) avec cycles de surcharge de rapport 2,3, (d) courbes F-N lissées selon le modèle Basquin. |
4.3 XES steel case
The fatigue behaviour of XES weld spots is opposite to the observed fatigue behaviour tendency for HE360D and XE360D grades (Fig. 8). The incidental overload among the cyclic tensile-shear loading greatly reduces the spot welded steel sheets fatigue lifetime. This decrease is amplified for the lower maximal applied loads of the reference fatigue tests. The lifetime is initially equal to 2.106 cycles (without overload) and becomes about 800 000 cycles with overload cycles.
 |
Fig. 8 Fatigue test results of XES specimens (a) without overload cycle (reference), (b) with 1.4 overload ratio, (c) with 2.3 overload ratio, (d) F-N Basquin curves. Résultats des essais de fatigue des éprouvettes en acier XES (a) sans cycles de surcharge (référence), (b) avec cycles de surcharge de rapport 1,4, (c) avec cycles de surcharge de rapport 2,3, (d) courbes F-N lissées selon le modèle de Basquin. |
5 Finite element analyses
5.1 Weld spot model
A 3D FE analysis of spot welded specimens was performed to calculate the maximum structural stress at the weld nugget edge of the joint. The model of spot welded HE360D steel specimens is depicted in Figure 9 (a). With respect to symmetry, only half the specimen was analysed (Fig. 9 (b)). To model the sheets lapped with the stiffener, the upper surface of both sheets is constrained in x-displacement around the weld spot (Fig. 9 (d)). The displacements are nevertheless free for the nodes attached to the surface indentation.
The finite element model is generated in the Salome-Meca 2016 environment by using the scripting python. A typical weld mesh is presented in Figure 10. Approximately, 392,300 tetrahedral solid elements have been used for the steel specimen model. In order to obtain an appropriate mesh structure that may enable accurate calculation of the stress states, a convergence analysis was carried out for the element size.
Numerical simulation of the weld mechanical response requires an appropriate description of the local HAZ constitutive behaviour in the weld. The material behaviour of all zones of the spot-welded assembly is replicated using experimental and numerical analysis results of Markiewicz [5] and Zuniga [6] for the XES and High Strength specimens respectively. The simplified partition of the weld zones is illustrated in Figure 9 (c). Table 2 gives the simulated weld dimensions and the constitutive material behaviours of each subzone are presented in Table 3. To represent the steel stress-strain behaviour, an elastic-plastic bilinear material model has been used.
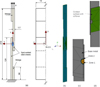 |
Fig. 9 Geometric model of the spot-welded specimen (a) design drawing and loading, (b) meshing, (c) stiffener modelling, (d) Discretization of the 3 material zones. Modèle géométrique de l’éprouvette soudée par point : (a) dessin de définition et chargement, (b) maillage, (c) modélisation du raidisseur, (d) discrétisation en 3 zones matériau distinctes. |
 |
Fig. 10 Meshing of the weld spot. Maillage du point soudé. |
Simulated weld dimensions (in mm).
Dimensions des zones définissant le point soudé dans le modèle numérique (en mm).
Local material properties of XE360D and XES specimens (in MPa).
Propriétés matériaux des éprouvettes en aciers XE360D et XES (en MPa).
5.2 Competition between shear fracture and sheet cracking failure modes
The spot-welded steel sheet specimens, subjected to tensile loading, display a stress concentration in the fillet radius joining the weld spot and the steel sheets. The high intensity of local stresses significantly impacts the service life under cyclic loading. The stress distribution in the weld spot and its vicinity is crucial to identify the locations of the cracks. Two capture lines illustrated on Figure 11 have been selected to plot the stress state components over these lines.
Figure 12 represents the distribution of stress components calculated with the 3D finite element model of XE360D specimen equipped with the stiffener and subjected to a 4500-N applied tensile load. Figure 12 (a) highlights a stress peak of σxy component on the nugget diameter in front of the notch tip related to the stress concentration induced by local geometry and tensile-shear loading. Figure 12 (b) shows similarly a stress peak of σyy component close to the fillet radius that joins the weld spot and the sheets. The cracking mechanisms are not the same on the nugget diameter ([CD] segment of line) and on the [AB] segment of line. There is a competition between both failure modes. On the [CD] diameter the maximal stress component is the shear stress σxy and the failure mechanism is the interfacial mode, whereas on the [AB] diameter the maximal stress component is the normal stress σyy and the failure mechanism is the sheet transverse fracture with crack initiation at the fillet radius root. The respective crack propagation velocity leads one of both failure modes to be finally predominant for the specimen failure. A crack inside a connected sheet to the weld spot is always observed in the case of a shear cracking. The opposite case is more difficult to study but has been observed by Rossillon [7]. As a matter of fact, both damaging fatigue process occur and develop practically simultaneously.
The welding residual stresses have not been considered in the simulation whereas Bae et al. [8] showed the fatigue strength at fatigue limit is about 25% lower than that without consideration of welding residual stresses. Many investigators [9,10] have numerically and experimentally assessed residual stresses in spot-welded steel sheets and showed the residual stress distribution was high tensile stress at the weld center and compressive toward the edge of the sheet and near the notch root where a fatigue crack initiates.
Furthermore, the effect of porosity and shrinkage voids in the weld spot [3] is not taken into account in the numerical simulations. Voids decrease the sheared surface area. Porosity in XE360D weld spot may therefore lead to the development of much higher stress at the interface on the [CD] segment of line.
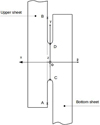 |
Fig. 11 Location description of the capture lines in the symmetry plane of the specimen model. Localisation des lignes de relevé des contraintes dans le plan de symétrie du modèle de l’éprouvette. |
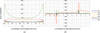 |
Fig. 12 Stress state components distributions of the XE360D specimen model with stiffener modelling, (a) on the nugget [CD] diameter, (b) in the upper sheet along the [AB] segment of line. Distributions des composantes du tenseur des contraintes de l’éprouvette en acier XE360D avec modélisation du raidisseur, (a) sur le diamètre [CD] du noyau, (b) dans la tôle supérieure le long du segment [AB]. |
5.3 Comparison between XE360D and XES stress and strain states
Figure 13 represents the normal stress distribution calculated with the 3D finite element model of XE360D and XES specimens at 3000 N and 6000 N applied loads. Figure 13 (a) highlights the localized stress concentration at the notch root at both applied loads, whereas Figure 13 (b) a stress peak only at 3000 N applied load. For higher load, one high stresses level appears at the notch root in the heat affected subzone 1 (2 ≤ y ≤ 2.4 mm), whereas normal stress values are strongly lower in subzone 2 (2.4 ≤ y ≤ 2.8 mm) and ductile BM (y ≥ 2.8 mm).
In order to know the impact of successive overloads on the local stress / strain fields, a small cycle followed with an overload have been applied in the numerical 3D model (Fig. 14). Figure 15 illustrates the cumulated plastic strain in the weld spot vicinity of both grade steels. It highlights some cumulated plastic strain in the heat-affected zone of the XES model, whereas the plastic strains are localized in the fillet radius in the XE360D model. Figure 15 (b) shows a large plastic deformation in the thickness of the XES sheet metal and on its upper surface, implying localized necking in this area. The deformation near the weld spot seems to be similar to the one of rigid button embedded in a ductile sheet.
Other successive overloads have been applied on the XES model. The evolution of the cumulated plastic strain and local multiaxial stress states are very low.
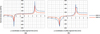 |
Fig. 13 Normal stress distribution at 3000 N and 6000 N applied loads. (a) XE360D model, (b) XES model. Distribution de la contrainte normale pour des efforts appliqués de 3000 et 6000 N. (a) Modèle XE360D, (b) modèle XES. |
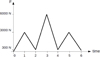 |
Fig. 14 Loading history used to analyse the impact of an overload on the stress/strain field. Cycle de chargement appliqué pour analyser l’impact d’une surcharge sur les champs de contraintes et de déformations. |
 |
Fig. 15 Cumulated plastic strain of (a) XE360 D and (b) XES models due to the loading history of Figure 15. Déformation plastique cumulée des (a) modèles XE360 D et (b) XES due au cycle de chargement de la Figure 15. |
5.4 Stress-based multiaxial fatigue life prediction method
A fatigue post-treatment tool based on the Dang Van criterion [11] is implemented by using a Python script in order to analyse the fatigue behaviour of the spot welded steel sheet specimens. A multiaxial fatigue criterion has been used since the stress states are multiaxial in stress concentration zones (Fig. 12). The Dang Van criterion in its first version (1973) is the first fatigue criterion introduced in the French industry (PSA Group). In this criterion, Dang Van postulates that crack initiation may occur in the most unfavourable oriented grains, which was subjected to a plastic deformation even if the bulk stress is elastic. This criterion is constructed on a microscopic approach to fatigue behaviour and the research for a critical shearing plane. It suggests that cracking factors are firstly the alternating part of the shear stress τha on a critical plane with normal h and secondly the hydrostatic pressure P. The damage fatigue function EDV is expressed as:
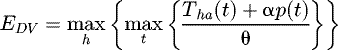 (1)
where α and θ are criterion parameters depending on S-N curves σ-1(N) and τ-1(N) that give the fatigue strengths of the material corresponding respectively to completely reversed tensile-compressive stress tests and completely reversed torsion tests. α and θ are determined by stating that the criterion is checked (EDV = 1) for these both basic fatigue strengths cycles. τha(t) is obtained by determining the smallest circle surrounding to the load trajectory [12]. The severity of the loading, in term of stress states cycle, can be appreciated by the closeness of the criterion fatigue function EDV to the unit value. In the case where EDV exceeds this unit value, the interpretation of the fatigue life criterion is that crack initiation occurs before the application of N identical load cycles.
(1)
where α and θ are criterion parameters depending on S-N curves σ-1(N) and τ-1(N) that give the fatigue strengths of the material corresponding respectively to completely reversed tensile-compressive stress tests and completely reversed torsion tests. α and θ are determined by stating that the criterion is checked (EDV = 1) for these both basic fatigue strengths cycles. τha(t) is obtained by determining the smallest circle surrounding to the load trajectory [12]. The severity of the loading, in term of stress states cycle, can be appreciated by the closeness of the criterion fatigue function EDV to the unit value. In the case where EDV exceeds this unit value, the interpretation of the fatigue life criterion is that crack initiation occurs before the application of N identical load cycles.
The used S-N curves for both materials XE360D (Eq. (2)) and XES (Eq. (3)) steels under purely reversed tensile loads are based on a Wöhler model:
 (2)
(2)
 (3)
(3)
The fatigue limits τ-1(N) under purely reversed torsion are deduced from the purely reversed tensile fatigue limit σ-1(N) by using Eq. (4):
 (4)
(4)
It is important to notice the given fatigue limits are those of base metal whereas the welding process induces microstructural changes and thus a deviation in the fatigue behaviour of fusion and heat affected zones.
Figure 13 represents only one stress tensor component σyy whereas the fatigue strength depends of six stress tensor components. The fatigue analysis is thus achieved by using the multiaxial fatigue criterion proposed by Dang Van. This approach allows calculating the fatigue indicator EDV on [AB] segment of line for a cyclic loading with a minimal value equal to 300 N and a maximal value equal to 3000 and 6000 N. The fatigue function has been computed for a number of cycles N equal to respectively 105 cycles and 106 cycles for the maximal applied load of 3000 N and 6000 N.
Figure 16 (a) highlights again a critical zone on the edge of the sheet near the notch root at both applied loads for XE360D specimens. Unlike XE360D model, Figure 16 (b) emphasizes a damage in the weld nugget at 6000 N applied maximal load which seems to predict an interfacial failure mode for this load range. The critical zone is ever localized near the fillet notch root in the sheet, nevertheless the fatigue function keeps a high value up to the boundary with the subzone 2 (y = 2.4 mm).
Figure 17 shows the impact of the 6000 N overload (Fig. 14) on the damage indicator EDV calculated for a 106 number of cycles. The critical damage zone has moved from the notch root to the boundary between both subzones at y = 2.4 mm. This simulated result is in line with the micrograph observations and schematic representation of fatigue crack path in deep drawing steel subjected to overload cycles (Fig. 5). The crack initiates in the sheet distant from the notch root and then follows a circumferential path within BM.
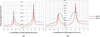 |
Fig. 16 Dang Van fatigue function EDV calculated for a maximal applied load of 3000 N at 106 cycles and for a maximal applied load of 6000 N at 105 cycles. (a) XE360D model, (b) XES model. Fonction de fatigue de Dang Van EDV calculée pour un effort maximal appliqué égal à 3000 N à 106 cycles et un effort maximal appliqué égal à 6000 N à 105 cycles. (a) Modèle XE360D, (b) modèle XES. |
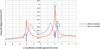 |
Fig. 17 Dang Van fatigue function EDV calculated for a maximal applied load of 3000 N at 106 cycles (a) without overload, (b) after a 6000 N overload. Fonction de fatigue de Dang Van EDV calculée pour un effort maximal appliqué égal à 3000 N à 106 cycles (a) sans surcharge, (b) après une surcharge égale à 6000 N. |
6 Discussion and conclusions
Experimental results have shown that incidental overloads applied once the hundred cycles are beneficial to the fatigue resistance of low alloyed high strength steel weld spots, as if the detrimental effect of the stress concentration was eliminated by preloading the specimens.
On the contrary, the incidental overloads are strongly detrimental for the fatigue life of the deep-drawing mild steel weld spots with occurrence of large cumulated plastic strain in the vicinity of notch root.
The effect on fatigue life of changing stress amplitudes has been studied for many decades and several investigators have observed some increase in the fatigue limit of 50 to 300% by preloading notched bars [13]. Furthermore, they show that the higher the strength of the material is, the greater is the increase in the fatigue limit, which tends toward the experimental results obtained with the high strength XE360D steel and the mild XES steel. This effect is probably due to residual compressive stresses resulting from overloading in the same direction as the applied service loading. It has also been noted that preloading has a greater influence at higher stress levels as it is observed for XE360D weld spots (Fig. 7(d)). This is apparently due to less fatigue softening of redistribution of stresses at the lower fatigue stress levels. Crack growth that can represent a significant part of the fatigue life is influenced by the load sequence. A significant delay in crack growth or complete arrest can result from tensile overloading. According to Kessler and Hillberry, there is even an optimum ratio of periodic overloads to fatigue cycles to obtain the greatest increase in fatigue life [14].
The opposite effect of periodical overloads on XES steel fatigue behaviour can be attributed to the low hardness of BM rather than HAZ and FZ, which produces a preferential location for necking as the load increases.
References
- X. Long, S. Khanna, Fatigue properties and failure characterization of spot welded high strength steel sheet, Int. J. Fatigue 29, 879 (2007) [CrossRef] [Google Scholar]
- H.D. Fant-Jaeckels, A. Galtier, Modèle de prévision de la tenue en fatigue de structures soudées par points, Rev. Metall./Cah. Inf. Tech. 1, 85 (2001) [Google Scholar]
- M. Pouranvari, S. Marashi, Critical review of automotive steels spot welding: process, structure and properties, Sci. Tech. Welding Joining 18(5), (2013) [Google Scholar]
- B. Tikri, Étude de l’influence de surcharges sur le comportement en fatigue d’aciers soudés par points, Thesis, Université Blaise Pascal − Clermont-Ferrand, France, 2012 [Google Scholar]
- E. Markiewics, B. Langrand, N. Leconte, J. Fabis, T. Dupuy, A methodology for the viscoplastic behaviour characterisation of spot-weld heat affected materials, J. Materials Processing Tech. 238, 169 (2016) [CrossRef] [Google Scholar]
- S. Zuniga, S. Sheppard, Determining the constitutive properties of the heat-affected zone in a resistance spot weld, Modelling Simul. Mater. Sci. Eng. 3, 391 (1995) [CrossRef] [Google Scholar]
- F. Rossillon, Influence des conditions de soudage sur le comportement en fatigue d’un acier THR Dual Phase soudé par point, Thesis, Université Blaise Pascal − Clermont-Ferrand, France, 2007 [Google Scholar]
- B.H. Bae, I.S. Sohn, J.K. Hong, Assessing the effects of residual stresses on the fatigue strength of spot welds, Welding Journal-New York, (2003) [Google Scholar]
- M. Anastassiou, M. Babbit, J.L. Lebrun, Residual stress and microstructure distribution in spot-welded steel sheet: relation with fatigue behaviour. Mater. Sci. Eng. A125, 141 (1990). [CrossRef] [Google Scholar]
- I. Ranjbar Nodeh, S. Serajzadeh, A.H. Kokabi, Simulation of welding residual stresses in resistance spot welding, FE modeling and X-ray verification, J. Mater. Proc. Technol. 205, 60 (2008) [CrossRef] [Google Scholar]
- K. Dand Van, Macro-micro approach in high-cycle fatigue. Adv. Multiaxial Fatigue, 120 (1993). [CrossRef] [Google Scholar]
- B. Weber, B. Kenmeugne, J.C. Clement, J.L. Robert, CMS, Improvements of multiaxial fatigue criteria computation for a strong reduction of calculation duration 15, 381 (1999) [Google Scholar]
- B.M. Hillberry, J.F. Hamilton, Improvement in fatigue behavior by overloading, Int. Compressor Eng. Conf. 26, (1972) [Google Scholar]
- A.F. Kessler, B.M. Hillberry, The effect of periodic overstress on the fatigue life of notched aluminium specimens, Society of Automotive Enginers, No 710599 (1971) [Google Scholar]
Cite this article as: Fabienne Pennec, Bianzeubé Tikri, Sébastien Bergamo, Michel Duchet, Bastien Weber, Jean-Louis Robert, Experimental and numerical investigation of the overload effect on fatigue behaviour of spot-welded steel sheets, Matériaux & Techniques 106, 309 (2018)
All Tables
Chemical composition and tensile properties of the steel grades (transverse direction).
Composition chimique et propriétés mécaniques des nuances d’acier (sens travers de laminage).
Simulated weld dimensions (in mm).
Dimensions des zones définissant le point soudé dans le modèle numérique (en mm).
Local material properties of XE360D and XES specimens (in MPa).
Propriétés matériaux des éprouvettes en aciers XE360D et XES (en MPa).
All Figures
|
Fig. 1 Spot-weld cross-section. Coupe transversale d’un point soudé. |
| In the text | |
|
Fig. 2 Geometry of tested specimens. Géométrie des éprouvettes. |
| In the text | |
|
Fig. 3 Typical overloads and fatigue cycling used to obtain F-N curves with incidental overloads. Représentation des cycles de fatigue appliqués pour l’obtention des courbes F-N avec surcharges incidentelles. |
| In the text | |
|
Fig. 4 Interfacial failure mode and sheet transverse failure mode. Faciès des sections rompues par fatigue (a) dans le cas d’une rupture par cisaillement du noyau, (b) pour le cas d’une fissuration de la tôle. |
| In the text | |
|
Fig. 5 Schematic representation of fatigue crack paths (a) in high strength steel and (d) in deep drawing steel subjected to overload cycles, (b) micrographs of HE360D specimen, (c) XE360D specimen, (e, f) XES specimens with 2.3 overload ratio. Représentation schématique de la propagation de fissure par fatigue (a) dans les aciers à haute limite d’élasticité, (d) dans les aciers doux pour emboutissage soumis à des cycles avec surcharges, (b) images 2D et 3D d’échantillons en acier HE360D, (c) XE360D, (e, f) XES avec rapport de surcharge égal à 2,3. |
| In the text | |
|
Fig. 6 Fatigue test results of HE360D specimens (a) without overload cycle (reference), (b) with 1.4 overload ratio, (c) with 2.3 overload ratio, (d) F-N smoothed Basquin curves. Résultats des essais de fatigue sur éprouvettes en acier HE360D (a) sans cycles de surcharge (référence), (b) avec cycles de surcharge de rapport 1,4, (c) avec cycles de surcharge de rapport 2,3, (d) courbes F-N lissées selon le modèle Basquin. |
| In the text | |
|
Fig. 7 Fatigue test results of XE360D specimens (a) without overload cycle (reference curve), (b) with 1.4 overload ratio, (c) with 2.3 overload ratio, (d) F-N Basquin curves. Résultats des essais de fatigue des éprouvettes en acier XE360D (a) sans cycles de surcharge (référence), (b) avec cycles de surcharge de rapport 1,4, (c) avec cycles de surcharge de rapport 2,3, (d) courbes F-N lissées selon le modèle Basquin. |
| In the text | |
|
Fig. 8 Fatigue test results of XES specimens (a) without overload cycle (reference), (b) with 1.4 overload ratio, (c) with 2.3 overload ratio, (d) F-N Basquin curves. Résultats des essais de fatigue des éprouvettes en acier XES (a) sans cycles de surcharge (référence), (b) avec cycles de surcharge de rapport 1,4, (c) avec cycles de surcharge de rapport 2,3, (d) courbes F-N lissées selon le modèle de Basquin. |
| In the text | |
|
Fig. 9 Geometric model of the spot-welded specimen (a) design drawing and loading, (b) meshing, (c) stiffener modelling, (d) Discretization of the 3 material zones. Modèle géométrique de l’éprouvette soudée par point : (a) dessin de définition et chargement, (b) maillage, (c) modélisation du raidisseur, (d) discrétisation en 3 zones matériau distinctes. |
| In the text | |
|
Fig. 10 Meshing of the weld spot. Maillage du point soudé. |
| In the text | |
|
Fig. 11 Location description of the capture lines in the symmetry plane of the specimen model. Localisation des lignes de relevé des contraintes dans le plan de symétrie du modèle de l’éprouvette. |
| In the text | |
|
Fig. 12 Stress state components distributions of the XE360D specimen model with stiffener modelling, (a) on the nugget [CD] diameter, (b) in the upper sheet along the [AB] segment of line. Distributions des composantes du tenseur des contraintes de l’éprouvette en acier XE360D avec modélisation du raidisseur, (a) sur le diamètre [CD] du noyau, (b) dans la tôle supérieure le long du segment [AB]. |
| In the text | |
|
Fig. 13 Normal stress distribution at 3000 N and 6000 N applied loads. (a) XE360D model, (b) XES model. Distribution de la contrainte normale pour des efforts appliqués de 3000 et 6000 N. (a) Modèle XE360D, (b) modèle XES. |
| In the text | |
|
Fig. 14 Loading history used to analyse the impact of an overload on the stress/strain field. Cycle de chargement appliqué pour analyser l’impact d’une surcharge sur les champs de contraintes et de déformations. |
| In the text | |
|
Fig. 15 Cumulated plastic strain of (a) XE360 D and (b) XES models due to the loading history of Figure 15. Déformation plastique cumulée des (a) modèles XE360 D et (b) XES due au cycle de chargement de la Figure 15. |
| In the text | |
|
Fig. 16 Dang Van fatigue function EDV calculated for a maximal applied load of 3000 N at 106 cycles and for a maximal applied load of 6000 N at 105 cycles. (a) XE360D model, (b) XES model. Fonction de fatigue de Dang Van EDV calculée pour un effort maximal appliqué égal à 3000 N à 106 cycles et un effort maximal appliqué égal à 6000 N à 105 cycles. (a) Modèle XE360D, (b) modèle XES. |
| In the text | |
|
Fig. 17 Dang Van fatigue function EDV calculated for a maximal applied load of 3000 N at 106 cycles (a) without overload, (b) after a 6000 N overload. Fonction de fatigue de Dang Van EDV calculée pour un effort maximal appliqué égal à 3000 N à 106 cycles (a) sans surcharge, (b) après une surcharge égale à 6000 N. |
| In the text | |
Current usage metrics show cumulative count of Article Views (full-text article views including HTML views, PDF and ePub downloads, according to the available data) and Abstracts Views on Vision4Press platform.
Data correspond to usage on the plateform after 2015. The current usage metrics is available 48-96 hours after online publication and is updated daily on week days.
Initial download of the metrics may take a while.