")
")
| Issue |
Matériaux & Techniques
Volume 110, Number 6, 2022
|
|
|---|---|---|
| Article Number | 601 | |
| Number of page(s) | 12 | |
| Section | Materials production and processing | |
| DOI | https://doi.org/10.1051/mattech/2022042 | |
| Published online | 25 November 2022 | |
Regular Article
A model of micro-milling cutting forces based on micro-cutting experiments including tool eccentricity and deflection
Modèle d’efforts de coupe en micro-fraisage à partir d’essais de micro-coupe élémentaire et incluant l’excentration et la flexion d’outil
1
LEM3, UMR 7239, Université de Lorraine / Arts et Métiers ParisTech / ENIM / CNRS, 4 rue Augustin Fresnel, 57078 Metz, France
2
FEMTO-ST Institute, UMR 6174, UBFC / UFC/ ENSMM / UTBM / CNRS, Department of Applied Mechanics, 24 rue de l’Épitaphe, 25000 Besançon, France
* e-mail: This email address is being protected from spambots. You need JavaScript enabled to view it.
Received:
3
March
2022
Accepted:
29
September
2022
Abstract
In this study, a model of micro-milling cutting forces based on elementary cutting experiments is developed. Elementary cutting tests were used to identify the parameters of a new model that includes the uncut chip thickness and the effect of the cutting edge radius. This model assumes a straight cutting edge and a rigid cutting tool and is divided into two terms that represent the ploughing and shearing regimes. The complex shape of the cutting edge of the micro-end-mill is decomposed into linear elementary edges to which the force model can be applied. The uncut chip thickness during tool rotation includes the tool path deviation due to tool run-out and deflection. Micro-milling experiments were performed using a micro-end-mill with the same cutting edge geometry as the tool used in elementary cutting experiments on AISI 6F7 steel. Comparisons between the force model and the experimental results show a good correlation. This model can be extended to a ball-nose micro-end-mill to consider a wide range of operations and can be used to predict and avoid machining errors due to deflection and even tool breakage.
Résumé
Un modèle d’efforts de coupe pour le micro-fraisage à partir d’essais de micro-coupe élémentaire est proposé dans cet article. Des essais de micro-coupe élémentaire ont permis d’identifier les paramètres d’une loi de coupe adaptée au micro-usinage et intégrant les effets de l’épaisseur de copeau non coupé et du rayon d’acuité d’arête. Cette loi de coupe est la somme de deux termes représentants les régimes de labourage et de coupe par cisaillement pour une arête élémentaire droite et rigide. Concernant la géométrie complexe d’une micro-fraise, elle est discrétisée en arêtes rectilignes élémentaires sur lesquelles la loi de coupe est appliquée. L’épaisseur de copeau non déformé sur un tour de micro-fraise prend en compte l’écart théorique dû à la flexion de l’outil et à l’excentration par rapport à l’axe de rotation. Des essais de micro-fraisage d’acier 40NiCrMo16 (AISI 6F7) ont été menés avec des micro-fraises ayant un rayon d’acuité d’arête semblable à celui des outils utilisés pour les essais de micro-coupe élémentaire. La comparaison des efforts de coupe mesurés lors de ces essais avec les efforts théoriques obtenus par le modèle montre une corrélation importante. Ce modèle pourrait être étendu au micro-fraisage par outil hémisphérique permettant d’étendre l’étude à d’autres opérations. Il pourrait également permettre de prédire et éviter les problèmes d’usinage liés à la flexion ou la casse d’outil.
Key words: micro-milling / elementary cutting / modelling / cutting forces / tool deflection / run-out
Mots clés : micro-fraisage / coupe élémentaire / modélisation / efforts de coupe / flexion d’outil / faux-rond
© R. Piquard et al., 2022
 This is an Open Access article distributed under the terms of the Creative Commons Attribution License (https://creativecommons.org/licenses/by/4.0), which permits unrestricted use, distribution, and reproduction in any medium, provided the original work is properly cited.
1 Introduction
In the context of miniature-manufactured components, micromachining has furnished solutions to many challenges. Nevertheless, some challenges remain inherent to micromachining, such as predictive modelling and validation as concluded by Balázs et al. [1]. As reported by Camara et al. [2], micro-milling has evolved and shown promising results.
The main issues in micro-milling are associated with size effects. The tools used for micro-milling do not have the same complex geometry and proportional sharpness of conventional tools due to manufacturing difficulties [3]. As reported by Aramcharoen and Mativenga [4], when the uncut chip thickness is close to the radius of the cutting edge, ploughing predominates during chip formation, leading to an increase in the specific cutting forces, as well as an amplified burr formation as found by authors [5] or an increase of tool deflection [6]. Material homogeneity is also an important issue for the process’s stability, as demonstrated by Vogler et al. [7] and Mian et al. [8]. Filiz and Ozdoganlar [9] presented a model for micro-end-mills dynamic using 3D linear elasticity equations. The paper demonstrated the large influence of tool geometry (helix angle, tool tip aspect ratio, diameter) on dynamic behaviour of the tool. The difficulty of identifying the parameters for each size effect led to independent studies of each, but such issues remained.
Mamedov et al. [10] modelled a distributed load on tool tip in order to evaluate and compensate tool deflection. A system of equations was solved to calculate compensated tool path and cutting forces. Kim et al. [11] suggested that chip formation in micro-milling was intermittent due to the tool deflection caused by ploughing forces when the uncut chip thickness was less than a minimum value. A non-cutting zone in which a jump in the force was observed was present for smaller chip thicknesses. Ramos et al. [12] investigated minimum chip thickness through surface roughness measurements, and concluded that ploughing dominated process under a minimum chip thickness, leading to a decrease in surface roughness and to an increase of the compressive residual stresses. Altintas and Jin [13] developed a specific slip line field to investigate the effect of the radius of the cutting edge during micro-cutting. An associated force model taking into account the uncut chip thickness h and cutting edge radius rβ exhibits a non-linearity when h is close to rβ. In the model presented by Rodriguez and Labarga [14], and in a following work [15], all of the common size effects have been taken into account. A linear cutting model that included tool-run-out, asymmetric cutting, deflection, and refusal to cut chips of less than the minimum thickness was considered. Park and Malekian [16] proposed a mechanistic model that depended on a minimum chip thickness. When the uncut chip thickness was less than this value, the cutting force was a function of the contact area between material and the tool, and ploughing emerged as the dominant type of cutting. For greater thicknesses, the cutting force was a linear function of the uncut chip thickness. Afazov et al. [17] computed the uncut chip thickness from the trochoidal trajectories of the teeth. A cutting force model was deduced from FEM simulations using a Johnson–Cook constitutive law that depended on the uncut chip thickness and the cutting velocity. The cutting forces during micro-milling were deduced from this model using the ratio between the depth and width of the cut in the FEM model. Based on the FE-based simulation study, Woon et al. [18] found that ratio of uncut chip thickness to tool edge radius influenced chip formation mechanism, material deformation and stress distribution in micromachining and concluded that shear was not dominant in primary deformation zone. Bissacco et al. [19] proposed a model based on the unified mechanics of a cutting approach in which the nominal rake angle was replaced by an effective rake angle, which was defined by the tangential direction of the tool outline at an altitude corresponding to the uncut chip thickness. These models have provided interesting results concerning micro-milling cutting forces, but too few studies have investigated micro-cutting mechanisms experimentally to link micro-milling to its phenomenological aspects.
The method used in this study is to decouple micro-milling kinematics and force modelling. Force modelling is investigated using elementary cutting experiments that involve turning tools that are geometrically related to the micro-end-mills used in micro-milling experiments. The force model and its associated parameters are then used to predict the cutting forces in micro-milling based on the tool geometry and run-out.
2 Model development
2.1 Force modelling
The model of the cutting forces used in this study consists of a phenomenological model including ploughing and shearing regimes developed by authors in a previous work [20]. A transient stage can also occur, as shown by Kim et al. [11]. The model is divided into two terms. The model expresses the forces Fi (Fc, Fp and Ff) during oblique cutting as functions of the uncut chip thickness, the width of the cut and the cutting edge radius. Fc is the force in the direction of the cutting speed, Ff is the force in the feed direction and Fp is the force in the transverse direction (orthogonal to the other two). The model is given in equation (1):
 (1)
(1)
where Kij and αij are constant parameters, h the uncut chip thickness, w is the width of the cut and rβ is the cutting edge radius. When uncut chip thickness is close to 0, the model tends toward equation (2) and represents ploughing regime:
 (2)
(2)
When the uncut chip thickness increases, the second term dominates, and the shearing regime is modelled by the linear equation given in equation (3):
 (3)
(3)
In this study, a micro-end-mill with no helix angle and with a rake angle of 0° was used. To make its micro-cutting and micro-milling behaviour equivalent, orthogonal micro-cutting experiments with a tool that has a rake angle of 0° are conducted.
According to [20], orthogonal micro-cutting experiments were conducted using a Röders RP600 milling machine. The cutting forces were measured using a Kistler Minidyn 9256C2 dynamometer with a Kislter 9017 amplifier. The data were saved using an NI CompactDaq and LabVIEW. The cutting tools used in the experiments were IFANGER MTNY 41015-R-TiAlN micro-turning tools with a cutting edge length of 1 mm and a TiAlN coating. The nominal rake angle was 0°. The cutting edge radius of the tools was approximately 1.54 μm. The machined material was an AISI 6F7 hardened tool steel, which is often used to manufacture injection moulds.
The measured forces are shown in Figure 1, which includes markers for each measured point and continuous lines that identify the model’s results. The parameters were identified using the Levenberg–Marquardt method implemented in the MATLAB routine MIC2M [21]. The model parameters are presented in Table 1.
The thrust force was greater than the cutting force for uncut chip thicknesses of less than 2 μm due to the significant ploughing regime. For values greater than 2 μm, the cutting force increased while the shearing regime was predominant, leading to values of the coefficients Kc2 and Kc3 that were greater than the values of Kf2 and Kf3, respectively.
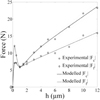 |
Fig. 1 The dependence of the cutting and thrust forces on the uncut chip thickness, h. Dépendance des efforts de coupe et d’avance à l’épaisseur de copeau non coupé h. |
2.2 model of geometrical micro-milling
Micro-milling is quite complex in comparison to micro-cutting. This is due to the geometry of the tools, which enables numerous simultaneous cutting configurations, and to complex dynamics. A predictive model of the cutting forces in micro-milling, adapted from the model of Fontaine et al. [22], can be used to discretise the cutting edge into elementary linear cutting edges to which the elementary cutting force model can be applied.
In the present case, only tools with no more than two teeth were considered; such tools are commonly used in micro-end-milling.
For each cutting angle θ, the cutting forces were determined. The starting configuration (θ = 0°) occurred when the teeth at the tip of the tool were aligned with the Y-axis. The cutting tool was divided into slices of thickness dz, and in each slice, the cutting edge was considered a line.
An elementary linear cutting edge can be defined by two angles, κ and λs, the uncut chip thickness, h, and the width of the cut, w. In this case, w was equal to dz and λs was equal to the helix angle i0. The configuration is shown in Figure 2.
However, a configuration with an angle κ can be converted to a configuration with κ equal to zero and the cut width and oblique angle as defined by equations (4) and (5), respectively.
 (4)
(4)
 (5)
(5)
In this way, the cutting force was defined with reference to the cutting edge regardless of angle κ. This angle is taken into account to define the uncut chip thickness and to convert the cutting force from a local coordinate system to a global one.
For each slice and tooth, the uncut chip thickness was obtained by projecting the tool displacement in the normal direction  onto the spindle axis at the cutting point (Fig. 3). The tool displacement is based on the nominal feed per tooth fz, the actual tool deviation
  and the tool’s deviation from the previous path
  .
.
 (6)
(6)
Tool deviation, including run-out and deflection, was considered only in the (xy) plane (Fig. 4). Tool run-out was defined using the eccentricity between the tool axis and the spindle axis. The possible tilt angle between the tool axis and the spindle axis was neglected. The angle  was defined as the direction given by the two points defining the eccentricity and the Y-direction in the starting configuration. Deflection was defined as the displacement of a beam under a radial force Fr acting on the free tip.
 (7)
(7)
with
 (8)
(8)
 (9)
(9)
 (10)
(10)
 (11)
(11)
where E is the Young’s modulus, L is the effective length under the tool neck and I is the second moment of area. In a first approximation, the final parameter was determined by considering a beam with a circular cross-section. Its radius was associated with the cutting diameter. Z is the number of teeth. In this case, two teeth were considered, as described below.
Because cutting forces were not yet known at the actual cutting angle, θ, different amounts of deflection were simulated and the solution corresponding to the equilibrium case, i.e., when the radial cutting force was equal to the force due to tool deflection, was selected. In addition, the deviation due to the deflection of the previous tooth path  could not be computed without knowing the cutting forces associated with this previous position. Therefore, the deviation for each angular increment was saved and used when it was necessary.
With a large tool run-out, asymmetric cutting could occur and lead to cutting with only one tooth. To take this phenomenon into account, the uncut chip thickness for a single tooth acting in a rotation was also computed, and the minimum of the two possibilities was selected.
As shown in Figure 5, the normal direction was defined by the line from the spindle rotation point to the cutting point, creating angle ψj between this direction and the Y-axis. This angle took tool run-out and tool geometry into account.
 (12)
(12)
 (13)
(13)
 (14)
(14)
where δθz is the lag angle between the cutting point at height z and the tip of the reference tool defined in equation (14), i0 is the helix angle, and R0 is the nominal radius of the tool. The expression given in equation (13) can be used for a tool with more than two teeth by counting the teeth in an anti-clockwise direction (Z is the number of teeth). The third term of the definition of ψj represents the working rake angle’s deviation from the nominal one. In this study, the deviation does not exceed 0.4°.
When the uncut chip thickness was computed, elementary cutting forces at cutting angle θ and altitude z on flute j, denoted by dFψ, dFr and dFκ, were related to the cutting forces of elementary cutting, which are denoted as Fc, Ff and Fp, defined in Section 2.1. These elementary cutting forces can be expressed in a workpiece reference system using the following geometric transformation:
 (15)
(15)
where dFz is the cutting force in the direction orthogonal to the machined surface, dFx is the cutting force in the feed direction and dFy is the cutting force in a direction orthogonal to the previous two.
Then, by considering all of the elementary cutting forces along the cutting edges, global cutting force is:
 (16)
(16)
 |
Fig. 2 The equivalence of two cutting configurations. Équivalence de deux configurations de coupe. |
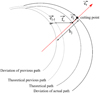 |
Fig. 3 definition of uncut chip thickness. Définition de l’épaisseur non coupée. |
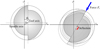 |
Fig. 4 The run-out parameters and tool deflection. Paramètres de faux-rond et de flexion d’outil. |
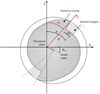 |
Fig. 5 The definitions of the cutting edge position and the normal direction at height z and angular position θ. Définitions de la position de l’arête de coupe et de la direction normale pour une altitude z et une position angulaire θ. |
2.3 The effect of radial run-out
Figure 6 shows polar plots of the modelled uncut chip thickness on one tool rotation during slot milling a feed of 10 μm per tooth and a radial run-out of 2 μm for different angles and without deflection. This figure highlights the relevance of run-out in micro-milling to tooth loads. In the worst case, i.e., 0°, when run-out represents only 20% of the feed per tooth and the maximum discrepancy in the uncut chip thickness between the two teeth is 8 μm, which is 80% of the feed per tooth. For an angle of 90°, shown in Figure 6d, run-out seems to have no effect on the uncut chip thickness. The two teeth are equally distant from the spindle axis. Then, the configuration is equivalent to a tool without run-out but with an angular tooth spacing of less than 180°. Because a tool’s run-out is generally less than its diameter, the difference in the uncut chip thickness is very small. When asymmetric cutting occurs, the maximum uncut chip thickness for the most heavily loaded tooth is twice the feed per tooth.
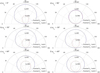 |
Fig. 6 Polar representations of the effect of tool run-out on the uncut chip thickness for each tooth for fz = 10 μm and r0 = 2 μm. Représentations polaires de l’effet du faux-rond sur l’épaisseur de copeau non coupé pour chacune des dents avec fz = 10 μm et r0 = 2 μm. |
2.4 The experimental set-up
Machining tests were performed using a KERN HSPC micro-milling machine. The experimental configuration is shown in Figure 7. The feed direction was parallel to the X-axis. Experiments were performed using a 0.5-mm-diameter carbide mill with a TiAlN coating, two teeth and no helix angle. In addition, the tooth corner was chamfered to 30 μm and the rake angle was 0°. The tool was observed using a 3D microscope (Alicona InfiniteFocus) to measure the cutting edge radius. For each tooth, the cutting edge radius appeared to be between 3 and 4 μm. The machined workpiece in these experiments was an AISI 6F7 that had already been used for micro-cutting experiments. Based on a previous study [23], the cutting speed was set to 40 m/min, leading to a nominal spindle frequency of 25 500 rpm. The axial depth of a cut, ap, was set to 50 μm. This study focused on the influence of the feed per tooth, a parameter that varied between 0.5 and 12 μm. Each experiment was repeated after declamping and reclamping the tool to change the values of the run-out parameters.
The cutting forces on the workpiece were measured using a Kistler Minidyn 9256C1 dynamometer, a Kistler 5080 charge amplifier and a National Instruments CompactDAQ with LabVIEW. The signal frequency was approximately 0.8 kHz, which is significantly less than the natural frequency of the system (4.2 kHz). The sampling frequency was set to 32 kHz, which allowed the system to record 75 data points for each complete tool revolution, providing enough information to describe the experiments as well as possible.
The tool run-out distance and angle were measured after tool clamping by optically observing the tool tip on the machine directly using a USB microscope (Fig. 8). The camera was oriented in the Z direction to provide a view of the tool tip. The tool tip was focused on to target the position of the tool axis, and rotating by 180° without any displacement provided a second point on the tool axis in the same plane. By extracting the tool boundary in both configurations using a dedicated MATLAB routine for image filtering, the position of the tool centre was determined after fitting the smallest circumscribed circle. Therefore, the gap between the two positions was equal to twice the eccentricity r0 and the angle between Y-axis and the direction given by the two points was equal to  . Due to optical and numerical resolution of the camera, this system could not detect a run-out of less than 1 μm.
A linear deviation or offset in the cutting force signal could have occurred during measurement. These errors were corrected later by measuring them on non-cutting signal before and after the material was removed. In addition, some noise was observed in the cutting force signal. This noise was removed by cutting a significant part of the measurements into segments corresponding to two tool rotations and computing the average values of all of these segments. A discrete Fourier transform was used to determine the actual spindle frequency, which can vary slightly from the nominal frequency, to determine the actual lengths of the segments. Therefore, a good approximation of the cutting forces was made without using a frequency filter.
 |
Fig. 7 The experimental configuration for the micro-milling tests. Configuration des essais de micro-fraisage. |
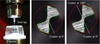 |
Fig. 8 Measuring the run-out: (a) setting the device and micro-mill up in the measuring zone and (b) centre detection for the initial position and (c) for the opposite position. Mesure du faux-rond : (a) système de mesure et micro-fraise dans la zone de mesure et (b) détection du centre de fraise pour la position initiale et (c) pour la position à 180°. |
3 Results and discussion
The tool run-out was measured before each set of experiments, and the corresponding parameters are given in Table 2. The large differences between the values indicate the difficulty and the importance of tool clamping.
The cutting forces, Fx and Fy, obtained using the model and from experiments are shown in Figures 9 and 10, respectively. In these figures, set 1 is on the left and set 2 is on the right. The first tooth is in cutting position from 0 to 180°, the second from 180 to 360°. The model’s results reproduced the experimental results correctly except for a slight overestimation. These predictions were evaluated using the absolute deviation proposed by Srinivasa and Shungam [24]. Predictions of Fx and Fy fit the results to within average discrepancies for 20 experiments of 7.59% and 7.72%, with maximum values of 10.22% and 10.39%, respectively. Run-out and asymmetric cutting were accurately accounted for, as well as tool deflection. For a rigid tool, asymmetric cutting was expected for set 1 until the feed per tooth reached approximately 15 μm, which was twice the run-out. Due to tool deflection, the unloaded tooth appeared to be loaded when fz = 10 μm in the experiment and 12 μm in the model. The same result holds for set 2; a load on the second tooth was not expected until a feed per tooth of 5 μm was reached, however, such a load was observed for fz = 3 μm in both cases.
As stated by Bissacco [19], tool deflection tends to reduce the imbalance between tooth loads. This phenomenon was modelled well by set 2 and is clearly shown in Figure 11, which contains a graph of the theoretical uncut chip thickness (discontinuous lines) for a rigid tool and the actual uncut chip thickness (continuous lines). By increasing fz, the difference between the theoretical and actual uncut chip thicknesses for each tooth decrease. As the nominal uncut chip thickness for the most heavily loaded cutting edge increases, the tool deviation also increases, leading to a higher uncut chip thickness in the next tooth’s path and reducing the imbalance due to tool run-out. However, this phenomenon is less obvious in the experimental results.
Some local peaks were observed in the modelled forces due to the force jump in the modelled cutting forces. The experimental results did not exhibit these peaks; this is explained by the fact that the model was derived using tube turning. During each rotation, material was removed from a hardened layer that amplified the force jump.
The results demonstrate that cutting forces are very sensitive to run-out, deflection and feed per tooth and that none of these three parameters can be neglected in developing an accurate model of micro-milling.
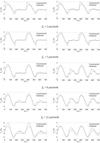 |
Fig. 9 Fx with fz = 0.5, 2, 5, 8, 12 μm/tooth for set 1 (left) and set 2 (right). Fx pour fz = 0,5, 2, 5, 8 et 12 μm/dent pour la configuration 1 (gauche) et la configuration 2 (droite). |
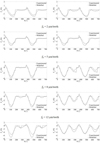 |
Fig. 10 Fy with fz = 0.5, 2, 5, 8, 12 μm/tooth for set 1 (left) and set 2 (right). Fy pour fz = 0,5, 2, 5, 8 et 12 μm/dent pour la configuration 1 (gauche) et la configuration 2 (droite). |
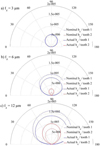 |
Fig. 11 The reduction in the imbalance of the uncut chip thickness due to tool deflection. Diminution du déséquilibre de l’épaisseur de copeau non coupé dûe à la flexion d’outil. |
4 Conclusion
In this study, the prediction of micro-milling cutting forces has been investigated using a model in which the forces were decoupled from the geometrical motion of micro-milling. The proposed force model was derived from orthogonal micro-cutting experiments. Tool run-out and deflection were included as relevant parameters for modelling micro-milling motion. The predicted cutting forces were in good agreement with the experimental results. The run-out, deflection and feed per tooth significantly influence the cutting forces in micro-milling; all three were represented well by the proposed model. Because run-out strongly influenced the cutting edges’ trajectories and the cutting forces, it was important to know the eccentricity and the orientation. The run-out was measured accurately at the tool tip using an optical method before the micro-milling tests were conducted.
To improve this model, a better understanding of chip formation during the ploughing regime is necessary. This can be achieved using thermomechanical simulations and further experimental investigations of elementary micro-cutting. Tool dynamics is another important issue in micro-milling that must be accounted for.
Acknowledgments
The authors wish to acknowledge the French Ministère de l’Enseignement Supérieur, de la Recherche et de l’Innovation (MESRI) for the financial support. This work was developed in the context of the Manufacturing’21 research group gathering 18 french laboratories in the field of advanced manufacturing. The authors also thank Gérard Michel from MIFHySTO platform for his technical support.
References
- B.Z. Balázs, N. Geier, M. Takács, et al., A review on micro-milling: recent advances and future trends, Int. J. Adv. Manuf. Technol. 112, 655–84 (2021), https://doi.org/10.1007/s00170-020-06445-w [CrossRef] [Google Scholar]
- M. Câmara, J.C.C. Rubio, A. Abrao, et al., State of the art on micro-milling of materials, a review, J. Mater. Sci. Technol. 28, 673–85 (2012) [CrossRef] [Google Scholar]
- D. Dornfeld, S. Min, Y. Takeuchi, Recent advances in mechanical micromachining, CIRP Ann. – Manuf. Technol. 55, 745–68 (2006), https://doi.org/10.1016/j.cirp.2006.10.006 [CrossRef] [Google Scholar]
- A. Aramcharoen, P.T. Mativenga, Size effect and tool geometry in micro-milling of tool steel, Precis. Eng. 33, 402–7 (2009), https://doi.org/10.1016/j.precisioneng.2008.11.002 [CrossRef] [Google Scholar]
- R. Piquard, A. d’Acunto, P. Laheurte, et al., Micro-end-milling of NiTi biomedical alloys, burr formation and phase transformation, Precis. Eng. 38, 356–64 (2014), https://doi.org/10.1016/j.precisioneng.2013.11.006 [CrossRef] [Google Scholar]
- S.N.B. Oliaei, Y. Karpat, Influence of tool wear on machining forces and tool deflections during micro-milling, Int. J. Adv. Manuf. Technol. 84, 1963–80 (2016), https://doi.org/10.1007/s00170-015-7744-4 [CrossRef] [Google Scholar]
- M.P. Vogler, R.E. DeVor, S.G. Kapoor, Microstructure-level force prediction model for micro-milling of multi-phase materials, J. Manuf. Sci. Eng. 125, 202–9 (2003) [CrossRef] [Google Scholar]
- A.J. Mian, N. Driver, P.T. Mativenga, A comparative study of material phase effects on micro-machinability of multiphase materials, Int. J. Adv. Manuf. Technol. 50, 163–74 (2010) [CrossRef] [Google Scholar]
- S. Filiz, O.B. Ozdoganlar, A three-dimensional model for the dynamics of micro-end-mills including bending, torsional and axial vibrations, Precis. Eng. 35, 24–37 (2011), https://doi.org/10.1016/j.precisioneng.2010.05.003 [CrossRef] [Google Scholar]
- A. Mamedov, E. Layegh, I. Lazoglu, Instantaneous tool deflection model for micro-milling, Int. J. Adv. Manuf. Technol. (2015), https://doi.org/10.1007/s00170-015-6877-9 [Google Scholar]
- C. Kim, J.R. Mayor, J. Ni, A static model of chip formation in microscale milling, J. Manuf. Sci. Eng. 126, 710 (2004), https://doi.org/10.1115/1.1813475 [CrossRef] [Google Scholar]
- A. Ramos, H. Autenrieth, T. Strauß, et al., Characterization of the transition from ploughing to cutting in micro machining and evaluation of the minimum thickness of cut, J. Mater. Process. Technol. 212, 594–600 (2012) [CrossRef] [Google Scholar]
- Y. Altintas, X. Jin, Mechanics of micro-milling with round edge tools, CIRP Ann. – Manuf. Technol. 60, 77–80 (2011) [CrossRef] [Google Scholar]
- P. Rodríguez, J.E. Labarga, A new model for the prediction of cutting forces in micro-end-milling operations, J. Mater. Process. Technol. (2012) [Google Scholar]
- P. Rodríguez, J.E. Labarga, Tool deflection model for micro-milling processes, Int. J. Adv. Manuf. Technol. 76, 199–207 (2015), https://doi.org/10.1007/s00170-014-5890-8 [CrossRef] [Google Scholar]
- S.S. Park, M. Malekian, Mechanistic modeling and accurate measurement of micro-end-milling forces, CIRP Ann. – Manuf. Technol. 58, 49–52 (2009) [CrossRef] [Google Scholar]
- S.M. Afazov, S.M. Ratchev, J. Segal, Prediction and experimental validation of micro-milling cutting forces of AISI H13 steel at hardness between 35 and 60 HRC, Int. J. Adv. Manuf. Technol. 62, 887–899 (2012), https://doi.org/10.1007/s00170-011-3864-7 [CrossRef] [Google Scholar]
- K.S. Woon, M. Rahman, The effect of tool edge radius on the chip formation behavior of tool-based micromachining, Int. J. Adv. Manuf. Technol. 50, 961–77 (2010), https://doi.org/10.1007/s00170-010-2574-x [CrossRef] [Google Scholar]
- G. Bissacco, H.N. Hansen, J. Slunsky, Modelling the cutting edge radius size effect for force prediction in micro-milling, CIRP Ann. – Manuf. Technol. 57, 113–6 (2008), https://doi.org/10.1016/j.cirp.2008.03.085 [CrossRef] [Google Scholar]
- R. Piquard, S. Thibaud, A. D’Acunto, et al., Phenomenological modelling of micro-cutting based on experimental results, Int. J. Adv. Manuf. Technol. 88, 3429–3436 (2017), https://doi.org/10.1007/s00170-016-9047-9 [CrossRef] [Google Scholar]
- F. Richard, Identification du comportement et évaluation de la fiabilité des composites stratifiés, UFC, 1999 [Google Scholar]
- M. Fontaine, A. Devillez, D. Dudzinski, Parametric geometry for modelling of milling operations, Int. J. Mach. Mach. Mater. 2, 186–205 (2007) [Google Scholar]
- A. Gilbin, M. Fontaine, G. Michel, et al., Capability of tungsten carbide micro-mills to machine hardened tool steel, Int. J. Precis. Eng. Manuf. 14, 23–8 (2013) [CrossRef] [Google Scholar]
- Y.V. Srinivasa, M.S. Shunmugam, Mechanistic model for prediction of cutting forces in micro-end-milling and experimental comparison, Int. J. Mach. Tools Manuf. 67, 18–27 (2013), https://doi.org/10.1016/j.ijmachtools.2012.12.004 [CrossRef] [Google Scholar]
Cite this article as: Romain Piquard, Gaël Le Coz, Michaël Fontaine, Sébastien Thibaud, A model of micro-milling cutting forces based on micro-cutting experiments including tool eccentricity and deflection, Matériaux & Techniques 110, 601 (2022)
All Tables
All Figures
|
Fig. 1 The dependence of the cutting and thrust forces on the uncut chip thickness, h. Dépendance des efforts de coupe et d’avance à l’épaisseur de copeau non coupé h. |
| In the text | |
|
Fig. 2 The equivalence of two cutting configurations. Équivalence de deux configurations de coupe. |
| In the text | |
|
Fig. 3 definition of uncut chip thickness. Définition de l’épaisseur non coupée. |
| In the text | |
|
Fig. 4 The run-out parameters and tool deflection. Paramètres de faux-rond et de flexion d’outil. |
| In the text | |
|
Fig. 5 The definitions of the cutting edge position and the normal direction at height z and angular position θ. Définitions de la position de l’arête de coupe et de la direction normale pour une altitude z et une position angulaire θ. |
| In the text | |
|
Fig. 6 Polar representations of the effect of tool run-out on the uncut chip thickness for each tooth for fz = 10 μm and r0 = 2 μm. Représentations polaires de l’effet du faux-rond sur l’épaisseur de copeau non coupé pour chacune des dents avec fz = 10 μm et r0 = 2 μm. |
| In the text | |
|
Fig. 7 The experimental configuration for the micro-milling tests. Configuration des essais de micro-fraisage. |
| In the text | |
|
Fig. 8 Measuring the run-out: (a) setting the device and micro-mill up in the measuring zone and (b) centre detection for the initial position and (c) for the opposite position. Mesure du faux-rond : (a) système de mesure et micro-fraise dans la zone de mesure et (b) détection du centre de fraise pour la position initiale et (c) pour la position à 180°. |
| In the text | |
|
Fig. 9 Fx with fz = 0.5, 2, 5, 8, 12 μm/tooth for set 1 (left) and set 2 (right). Fx pour fz = 0,5, 2, 5, 8 et 12 μm/dent pour la configuration 1 (gauche) et la configuration 2 (droite). |
| In the text | |
|
Fig. 10 Fy with fz = 0.5, 2, 5, 8, 12 μm/tooth for set 1 (left) and set 2 (right). Fy pour fz = 0,5, 2, 5, 8 et 12 μm/dent pour la configuration 1 (gauche) et la configuration 2 (droite). |
| In the text | |
|
Fig. 11 The reduction in the imbalance of the uncut chip thickness due to tool deflection. Diminution du déséquilibre de l’épaisseur de copeau non coupé dûe à la flexion d’outil. |
| In the text | |
Current usage metrics show cumulative count of Article Views (full-text article views including HTML views, PDF and ePub downloads, according to the available data) and Abstracts Views on Vision4Press platform.
Data correspond to usage on the plateform after 2015. The current usage metrics is available 48-96 hours after online publication and is updated daily on week days.
Initial download of the metrics may take a while.